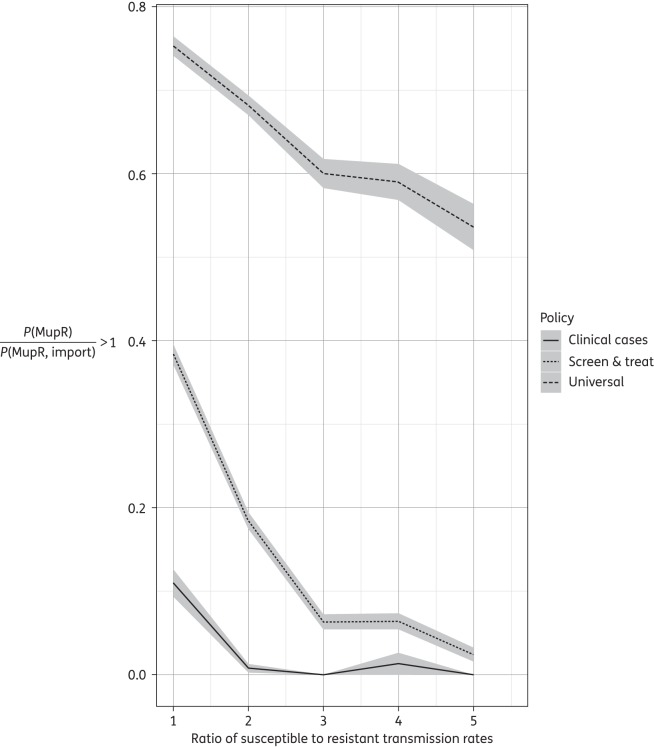
Figure 6.
Probabilistic sensitivity analysis: probability that the prevalence of MupR exceeds the prevalence of MupR in imported MRSA after 5 years. This is measured as the proportion of simulations where, P(MupR)/P(MupR, import) > 1. P(MupR) is the final prevalence of MupR in MRSA colonizations and P(MupR, import) is the prevalence of MupR in MRSA on admission, i.e. imported. Calculated for mupirocin treatment of clinical (infected) MRSA cases only (‘clinical cases’, continuous line), MRSA-positive patients (‘screen and treat’, dotted line) and universal mupirocin usage (‘universal’, dashed line). The line is the mean of the simulations and the grey bars the 95% CI.

