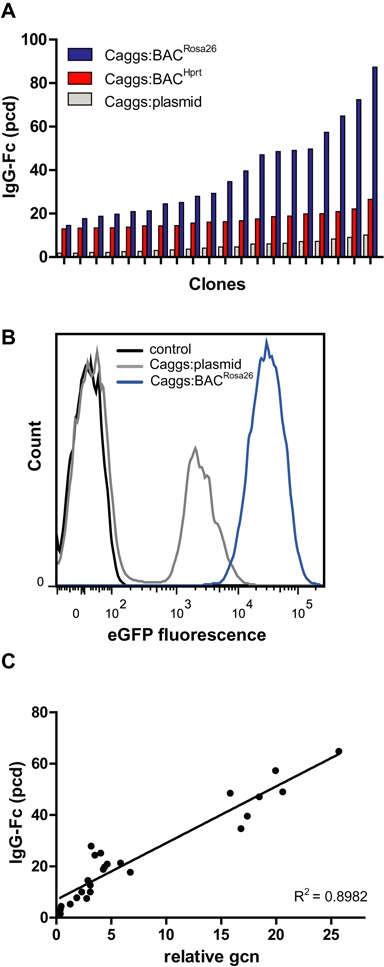
Figure 2.

Clonal distribution of IgG-Fc cell pools. (A) Specific productivity (pcd) of the 20 best clones out of 50 pre-screened clones derived from stable cell pools generated with the Caggs:BACRosa26, Caggs:BACHprt and Caggs:plasmid vectors. (B) FACS analysis shows eGFP fluorescence of Caggs:BACRosa26 and Caggs:plasmid stable cell pools expressing eGFP compared to empty plasmid control cells. (C) Correlation between specific productivity of Caggs:BACRosa26 clones and their integrated vector (gene) copy numbers (gcn) relative to Actb gcn, n = 25.
