Figure 5.

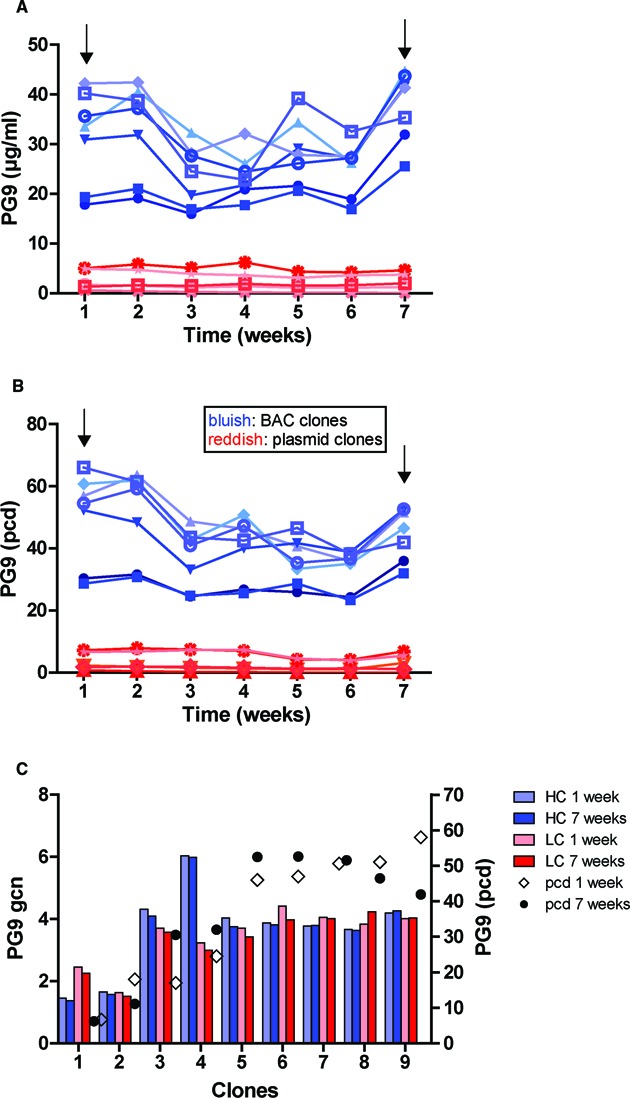
Long-term stability of PG9 antibody producing clones without selection pressure. (A) Volumetric (μg/ml) and (B) specific productivity (pcd) of BAC (in bluish color) and plasmid (in reddish color) clones generated from BAC HC/LC and p HC/LC stable pools during a 7 weeks culturing period. Arrows indicate sample collection for genomic DNA isolation. (C) LC and HC integrated vector copy changes were monitored in 9 BACRosa26 HC/LC clones. Gene copy numbers relative to genomic Actb (gcn) are indicated as bars. Light bars indicate gcn at the first week, dark bars indicate gcn at the seventh week (bluish color, HC; reddish color, LC); specific productivity of each clone is indicated on a dot plot.
