Figure 3.

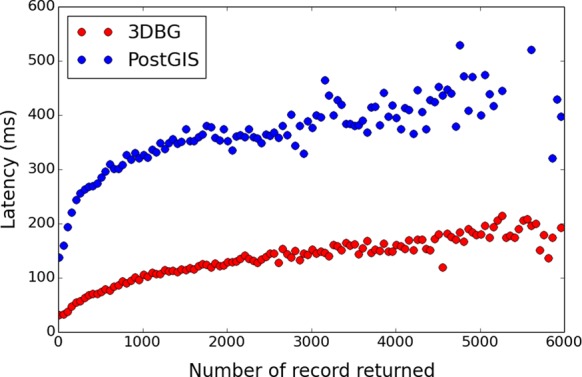
Comparison of 3DBG and PostGIS query latencies. The x-axis shows the number of records returned and the y-axis shows the latency in milliseconds (ms). Red dots are 3DBG data and blue dots PostGIS data.

Comparison of 3DBG and PostGIS query latencies. The x-axis shows the number of records returned and the y-axis shows the latency in milliseconds (ms). Red dots are 3DBG data and blue dots PostGIS data.