
Figure 2.
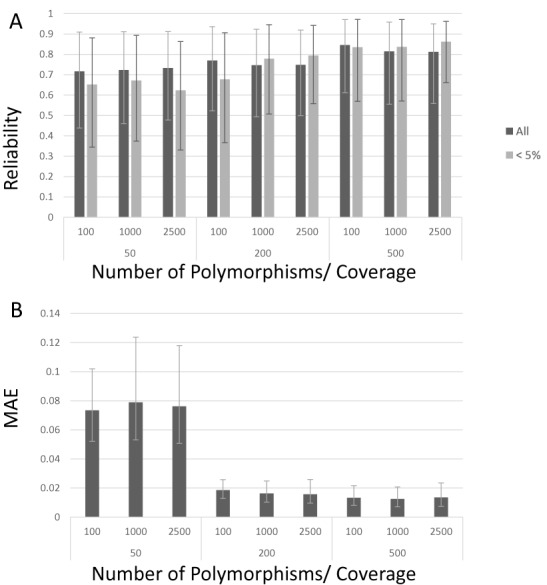
Reliability of haplotype reconstruction by EVORhA on simulated data. The X-axis displays the different combinations of coverage (respectively 50, 200, 500) and number of polymorphisms in the population (respectively 100, 1000, 2500) used for each simulated set up, hereby collapsing the results obtained for simulations with a different number of haplotypes (for the uncollapsed results see Supplementary Figure S4). The degree to which the simulated haplotypes was correctly reconstructed was assessed by the reliability. The correctness of the frequency estimation of the reconstructed haplotypes was assessed by the MAE. (A) Average reliability of the haplotype reconstruction, derived by either considering the results of all reconstructed haplotypes (dark bars) or only the results obtained for haplotypes that occur in the population at a frequency below 5% (light bars). Y-axis: average reliability; values are obtained by averaging the reliability scores of the considered haplotypes resulting from simulations obtained with the same coverage and same number of polymorphisms, irrespective of the number of haplotypes (so showing the average reliability of haplotypes obtained from 500 simulations). Error bars indicate the 90% confidence interval of the reconstruction. (B) Y-axis: MAE of the frequency estimation of all haplotypes resulting from simulations obtained with the same coverage and same number of polymorphisms, irrespective of the number of the haplotypes (see panel (A)). Error bars indicate the MAE 90% confidence interval.