
Figure 3.
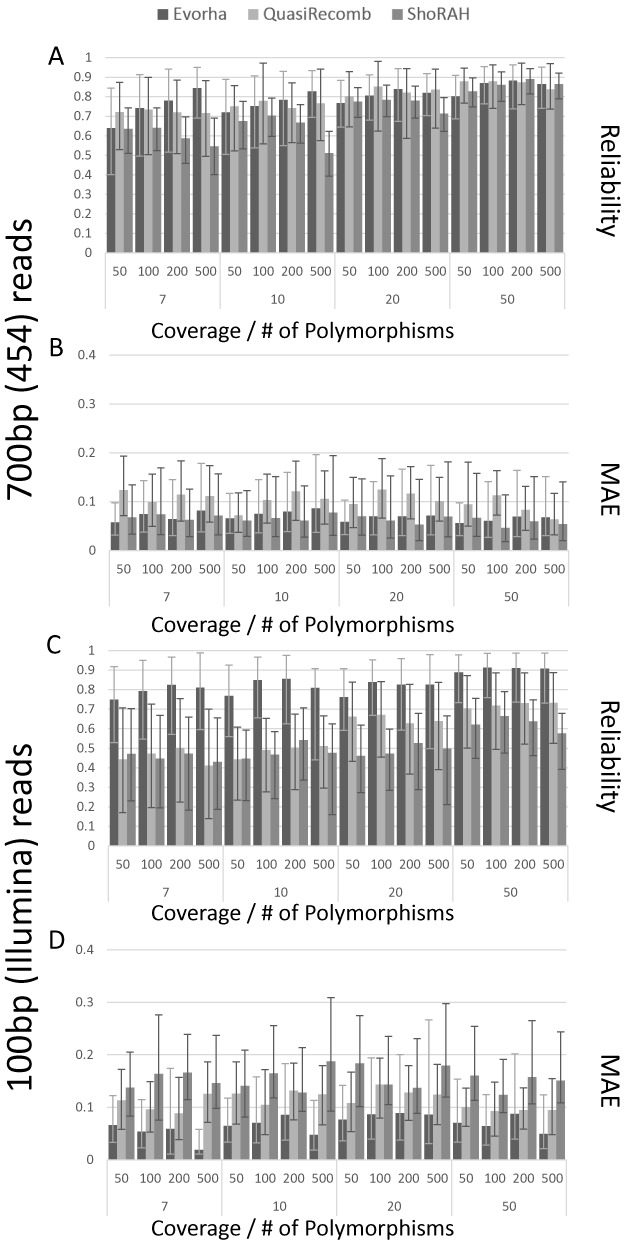
Performance comparison of EVORhA, ShoRAH and QuasiRecomb on simulated data. (A) Comparison of the reconstruction reliability using long read sequencing (700 bp), hereby collapsing the results obtained for simulations with a different number of haplotypes. Data sets were obtained by simulating long read sequencing. The X-axis displays the different combinations of coverage (respectively 50, 100, 200, 500) and number of polymorphisms in the population (respectively 7, 10, 20, 50) used for each experimental set up. The Y-axis shows the average reliability of the reconstruction. Bars indicate the performance per method. Reliability values are obtained by averaging the reliability scores of all haplotypes resulting from simulations obtained with the same coverage and same number of polymorphic sites, irrespective of the number of haplotypes. Error bars indicate the 90% confidence interval of the reconstruction. (B) Comparison of the frequency estimation of the haplotypes using long read sequencing. Experimental set up and legend as in panel (A) except for the Y-axis which displays the MAE of the frequency estimation for all haplotypes resulting from simulations obtained with the same coverage and same number of polymorphic sites, irrespective of the number of haplotypes. Error bars indicate the MAE 90% confidence interval. (C) Comparison of the reconstruction reliability using short read sequencing (100 bp). Legend and experimental set up as in panel (A), but displaying results obtained on data simulating short reads. (D) Comparison of the reconstruction reliability using short read sequencing. Legend and experimental set up as in panel (B), but displaying results obtained on data simulating short reads.