
Figure 5.
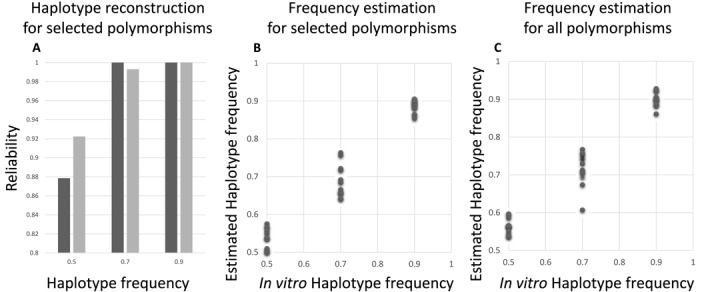
Haplotype reconstruction to identify mixed infections. (A) Reliability of the haplotype reconstruction of the mixed infection set up when using a selection of polymorphisms. The X-axis contains the three different in vitro proportions at which the mixed infection set ups were generated (50–50%, 30–70% and 10–90%). For each of the three proportions, 12 mixtures were obtained by mixing two different clonal DNA samples according to the indicated frequencies. The Y-axis indicates the average reliability of the two reconstructed haplotypes compared to the known haplotypes at the polymorphic sites. (B and C) Correctness of the frequency estimation in the mixed infection set up. For panels (B) and (C) the X-axis represents the known frequency of this haplotype in the mixture, whereas the Y-axis represents the estimated frequencies of the most frequent haplotype in each combination (the least frequent haplotype is not displayed as it would have a frequency of 1—the shown frequency). (B) Correctness of the frequency estimation based on a haplotype reconstructing using the 151 selected polymorphisms only (RMSE = 0.037, MAE = 0.030). (C) Correctness of the frequency estimation based on a haplotype reconstructing using all polymorphisms (RMSE = 0.047, MAE = 0.038).