Figure 4.

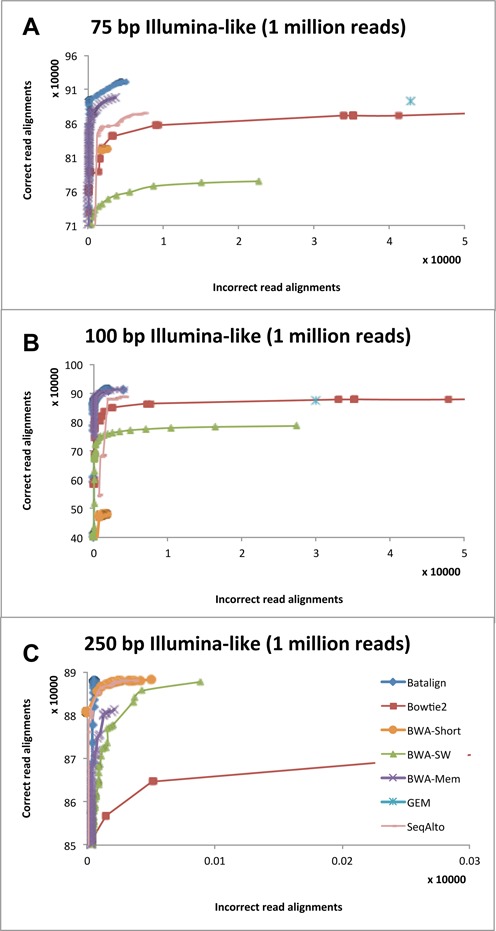
Sensitivity and accuracy for aligning simulated reads from ART. Cumulative counts of correct and wrong alignments from high to low mapping quality for simulated Illumina-like (A) 75-bp, (B) 100-bp and (C) 250-bp data sets.

Sensitivity and accuracy for aligning simulated reads from ART. Cumulative counts of correct and wrong alignments from high to low mapping quality for simulated Illumina-like (A) 75-bp, (B) 100-bp and (C) 250-bp data sets.