
Figure 4.
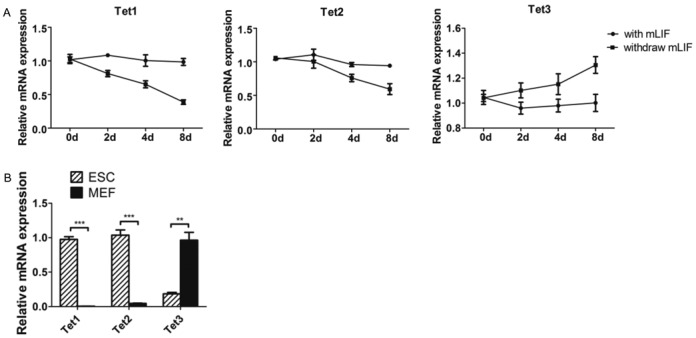
Expression pattern of Tet family in undifferentiated mESCs, differentiating EB and differentiated MEF. (A) The expression pattern of Tet family during EB formation. (B) The expression level of Tet family in mESCs and MEF. Each bar in the figure represents the mean ± SEM of triplicates. *P < 0.05, **P < 0.01 and ***P < 0.0001.