
Figure 3.
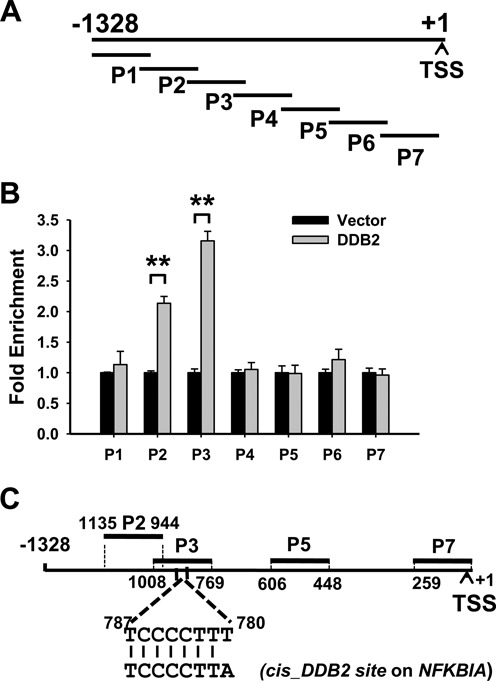
DDB2 binds to the promoter region of the NEDD4L gene. (A) The schematic representation of the human NEDD4L promoter region. The thick truncated lines mark the regions covered by primer sets of interest. TSS: Translation start site. (B) The ChIP assay was conducted to analyze the local enrichment of FLAG-tagged DDB2 across the NEDD4L promoter region in CP70 and FLAG-tagged DDB2-transiently transfected CP70 cells. The relative fold enrichment was quantified by normalization to input first, then normalized to CP70 cells, which is set at 1. (C) The schematic representation of the NEDD4L promoter region with a putative DDB2 binding site and the sequence alignment between the putative DDB2 binding site in the NEDD4L gene and that in the NFKBIA gene. N = 3, Error bars represent SD. **P < 0.01 compared with vector-transfected cells.