Figure 7.

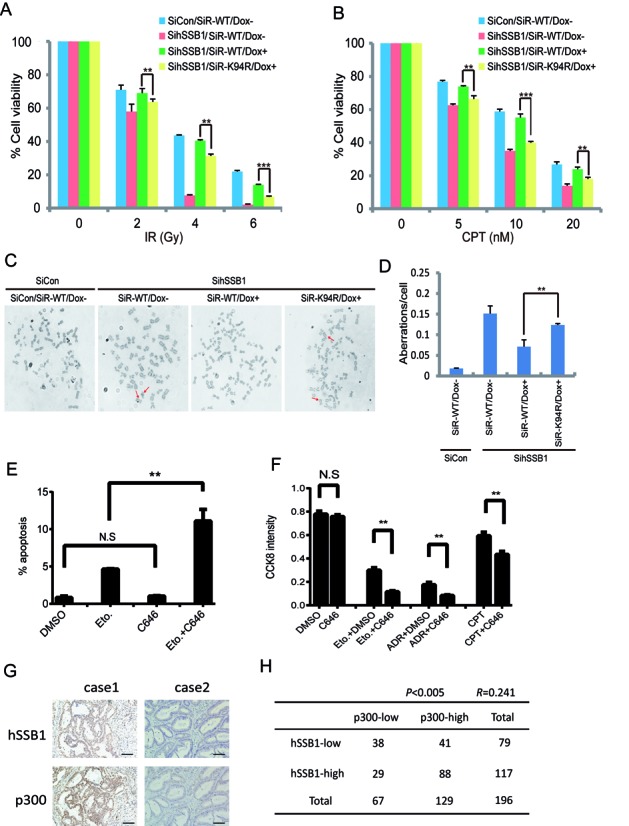
Inhibiting lysine 94 acetylation enhances cancer cell sensitivity to DNA damage agents. (A, B) Cells that express siRNA-resistant wild-type hSSB1 or its point mutant under the control of a tetracycline-inducible promoter were generated. The resulting cell lines were transfected twice with control or hSSB1 siRNAs. Following IR or CPT treatment, cells were permitted to grow for 14 days before staining. The experiments were performed in triplicate. The results shown are averages of three independent experiments. Bars indicate the SEM. **P < 0.01, ***P < 0.001, Student's t test. (C, D) Quantification of chromosomal aberrations in hSSB1-depleted HeLa cells expressing wild-type hSSB1 or hSSB1-K94R. The average of two experiments is shown. At least 50 cells were counted in each experiment. Bars indicate the SEM. **P < 0.01, Student's **t test. (E) U2OS cells were treated with either Eto (25 μM), C646 (10 μM) or combination for 24 h. The cells were then trypsinized and the percentage of apoptotic cells was detected by flow cytometry (n = 3), bars indicate the SEM. **P < 0.01, Student's t test. (F) U2OS cells were treated with C646 (10 μM) combined with Eto (10 μM), ADR (0.5 μM) or CPT (0.5 μM) for 48 h and the CCK8 activity of the cells was detected (n = 3), bars indicate the SEM. **P < 0.01, Student's t test. (G) Immunohistochemistry for hSSB1 and p300 was performed using 196 clinical colorectal cancer samples as described in the Materials and Methods section. Representative images of hSSB1 and of p300 expression levels in the same colorectal cancer sample. Case 1, both hSSB1 and p300 high expression. Case 2, both hSSB1 and p300 low expression. Scale bars: 100 μm. (H) A positive correlation was observed between hSSB1 and p300 in the 196 clinical colon cancer samples (P < 0.005, χ2 tests. R: Spearman correlation coefficient).
