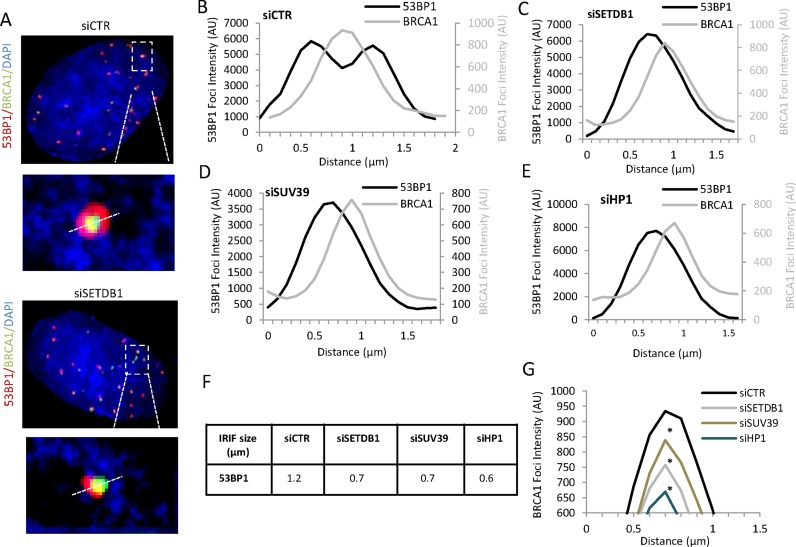
Figure 5.
SETDB1, SUV39 and HP1 are required for the repositioning of 53BP1 to the periphery of IRIF during HR. (A) Representative images of 53BP1 (red) and BRCA1 (green) foci used to generate the analysis in panels A–D. This figure shows how a line is drawn through the foci. Following siRNA control, 53BP1 entirely surrounds BRCA1 whereas following siRNA SETDB1 (siSETDB1) the two foci are off set. (B) A549 cells were depleted with siRNAs targeting control (CTR), SETDB1, SUV39, HP1, irradiated with 3 Gy IR and 48 h later co-stained with BRCA1 (green) and 53BP1 (red). The fluorescence intensity was quantified along a line drawn through the centre of 53BP1 foci to provide a fluorescence intensity profile using the softWoRx® suite software. In control cells 53BP1 has a bimodal distribution with BRCA1 being localized within the core of diminished intensity. (C, D and E) Similar quantification was carried out following siRNAs targeting control (CTR), SETDB1, SUV39 and HP1. The results show a monomodal distribution of 53BP1. The width of the peak for 53BP1 and BRCA1 are smaller than in the siCTR sample and the BRCA1 peak is off set relative to the 53BP1 peak. (F) Quantification of the width of 53BP1 foci. The foci width was determined by measuring the distance between the outer edges of the peaks at 50% intensity. (G) BRCA1 intensity following siRNA SETDB1, SUV39 or HP1 was reduced compared to control siRNA. In panels A–D, the maximum Y axis value was automatically set to the maximum fluorescence intensity of 53BP1 (left axis) and BRCA1 (right axis) giving the same size peak irrespective of absolute intensity. Note that BRCA1 intensity is about 10-fold less than the 53BP1 intensity. This panel shows the comparative intensity of BRCA1 following siRNA targeting control (CTR), SETDB1, SUV39 or HP1. Asterisks shows statistically significant difference between control and siRNA SETDB1, SUV39 or HP1 (P < 0.005; t-test).

