
Figure 7.
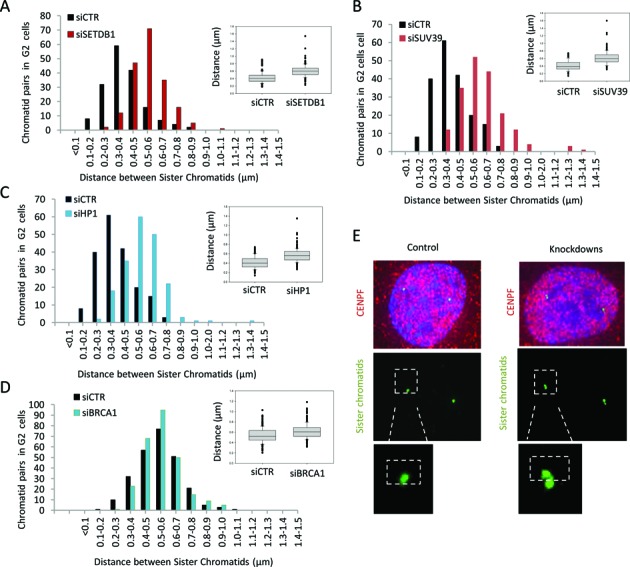
Depletion of HP1, SUV39 or SETDB1 impairs sister chromatid association. (A, B, C and D) The distance between sister chromatids was quantified in 1BR3 hTERT G2 cells transfected with siRNAs targeting control (CTR), SETDB1 (A), SUV39 (B), HP1 (C) and BRCA1 (D) using IF-FISH assay. The SoftWoRx® suite software was used to measure distance between the sister chromatids. The distance between the outer edges of the foci were measured. The distances between signals were measured from three independent experiments and the distribution was plotted as a histogram. Each individual experiment gave a similar difference in distribution. The box plot represents the corresponding clustered columns. Distribution counts from the FISH experiments were analysed using Mann–Whitney Rank Sum Test. (E) IF-FISH images for control siRNA and siRNA SETDB1. Not that since then two FISH spots frequently overlap, the distance between the outer edges were measured. The distances do not, therefore, represent actual sister separation differences but provide a readout for sister association.