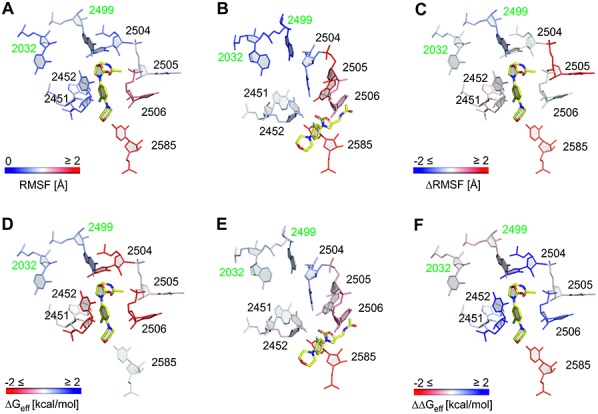
Figure 2.

RMSF and per-nucleotide contributions to the effective binding energy. Shown are nucleotides of the first shell of the binding site along with the two mutation sites 2032 and 2499 investigated in this study. The structure with the smallest RMSD to the average structure of the last 20 ns of the respective MD trajectory was used for visualization; linezolid is colored in yellow. (A–C) Per-nucleobase RMSF obtained from MD simulations of linezolid-H50Swt (A), linezolid-H50Smut (B) (deep blue: RMSF 0 Å; white: 1 Å; deep red: RMSF ≥ 2 Å) as well as the difference (linezolid-H50Smut – linezolid-H50Swt; deep blue: ≤ -2 Å; white: 0 Å; deep red: ≥ 2 Å). (D–F) Per-nucleotide contributions as computed by MM-PBSA for linezolid-H50Swt (D), linezolid-H50Smut (E) as well as the difference (linezolid-H50Smut – linezolid-H50Swt) (F) (deep red: ≤ −2 kcal mol−1; white: 0 kcal mol−1; deep blue: ≥ +2 kcal mol−1). Except for the mutated nucleotides, the data for the per-nucleotide decomposition for linezolid-H50Swt has been taken from (14).
