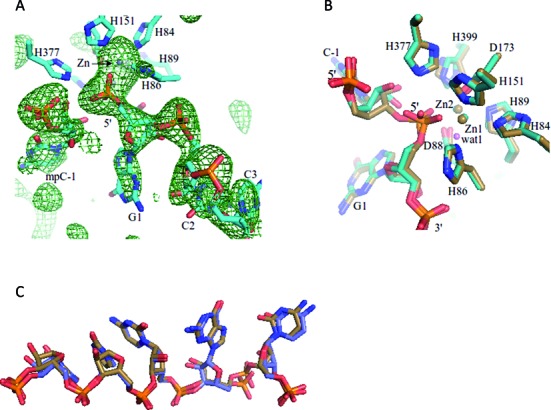
Figure 2.

A post-cleavage complex. (A) A Fo–Fc map (in green mesh) using data from Mn++-soaked crystals and phases calculated by omitting the RNA from the refined model. The map is countered at 2.5 sigma. The refined RNA (in stick) model is superimposed onto the omit map for comparison. (B) A comparison of pre-cleavage RNase J and RNA complex (in sand) with the post-cleavage complex (in teal). The proposed activated water molecule (labeled ‘wat1’) from the pre-cleavage complex is pink. (C) A comparison of the RNA in the pre-cleavage (in sand stick representation) with post-cleavage states (in blue stick representation).
