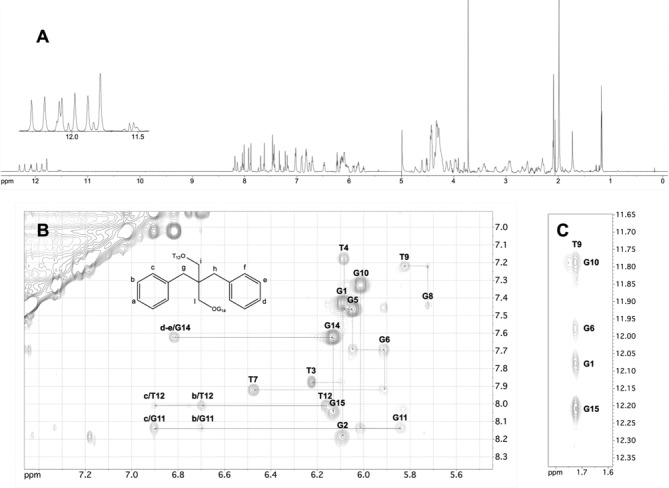
Figure 6.

NMR study of TBA-bs13 annealed in PBS/D2O 9:1 (10°C, 700 MHz). (A) 1H NMR spectrum. The expansion of the imino proton region is shown in the inset. (B, C) Expansions of the 2D NOESY (200 ms mixing time) spectrum. The NOE connectivities between atoms of X13 and nucleotides atoms are traced and labelled in panel B. The sequential H1′-H8 or H1′-H6 connectivities and the self-peaks involving H1′ protons have been drawn in B using dotted lines and labels, respectively. NOE correlations between T9 methyl protons and H8 protons of the G10-G1-G6-G15 tetrad are shown in C.
