
Figure 4.
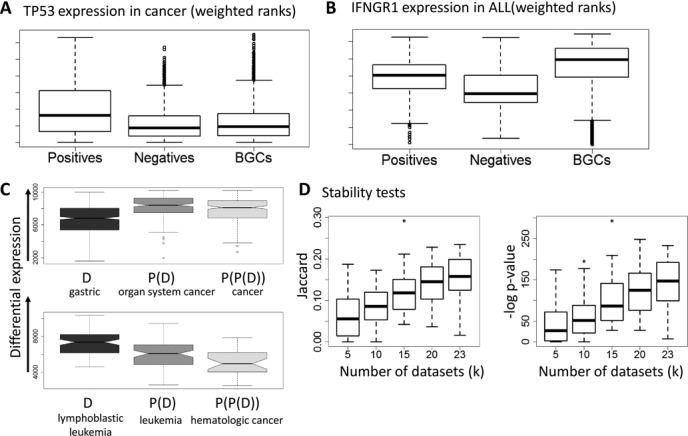
Expression patterns, specificity and robustness. (A) Expression of TP53 in cancer. (B) Expression of IFNGR1 in ALL. The y-axis represents the weighted rank of a gene, where higher ranks have better values. The boxplots show the expression distribution of the three sample cohorts: positives, negatives, and BGCs. TP53 is over-expressed in cancer compared to both negatives and BGCs. IFNGR1 is up-regulated compared to negatives, but down-regulated compared to BGCs. (C) Ranking of gastric cancer biomarker genes and of biomarkers for more general cancers on gastric cancer datasets. Plots for biomarkers of more general diseases (parent and grandparent nodes in the Disease Ontology) are further to the right. General cancer genes are ranked higher, indicating that analysis of these datasets alone will not discover the gastric cancer specific genes. (D) Testing stability. The plots show the overlap between solutions obtained using two disjoint sets of k disease datasets each, as a function of k. Each boxplot shows the distribution of the overlap scores for a specific k over 50 repeats.