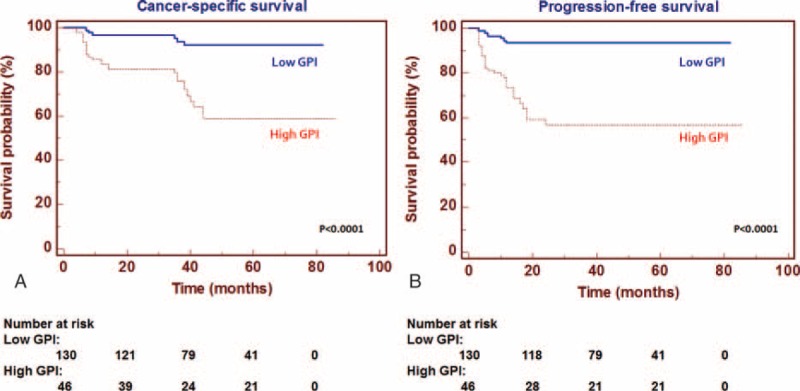
FIGURE 4.

Kaplan–Meier cancer-specific survival (CSS) and progression-free survival (PFS) curves, stratified by GPI/AMF tissue levels. Patients with high tissue levels of GPI/AMF had reduced CSS (Panel A) and PFS (Panel B) as compared with patients with lower values.
