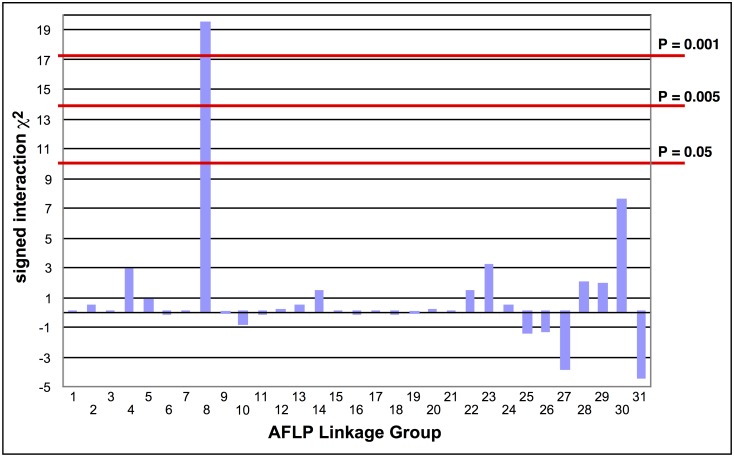
Fig 1. Tests of the association of AFLP linkage groups with Cry2Ab1 resistance in a bioassay of backcross progeny.
The signed interaction χ2 value shows the positive or negative association of the AFLP linkage group from the resistant grandparent with resistance in the progeny. Horizontal lines depict the Bonferroni-corrected probability values of P = 0.05, P = 0.005, and P = 0.001. Only AFLP linkage group 8 shows a significant positive association with resistance.

