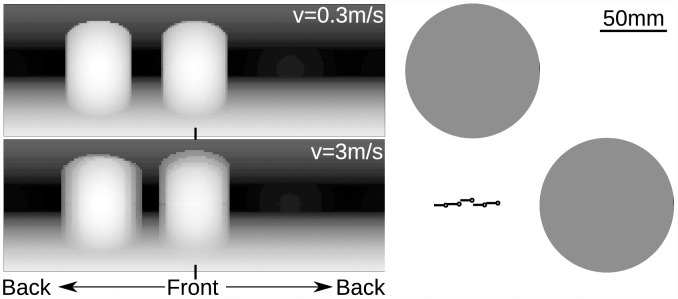
Fig 2. Blurred relative nearness of two cylindrical obstacles at high speed of the agent.
Left panels: Nearness maps computed from optic flow experienced during translation at a speed of 0.3ms−1 and 3ms−1. Right panel: Trajectory at the speed of 3ms−1 towards one obstacle. Black circle and black line represent the head and the body of the agent, respectively. Gray circles represent the objects seen from above.

