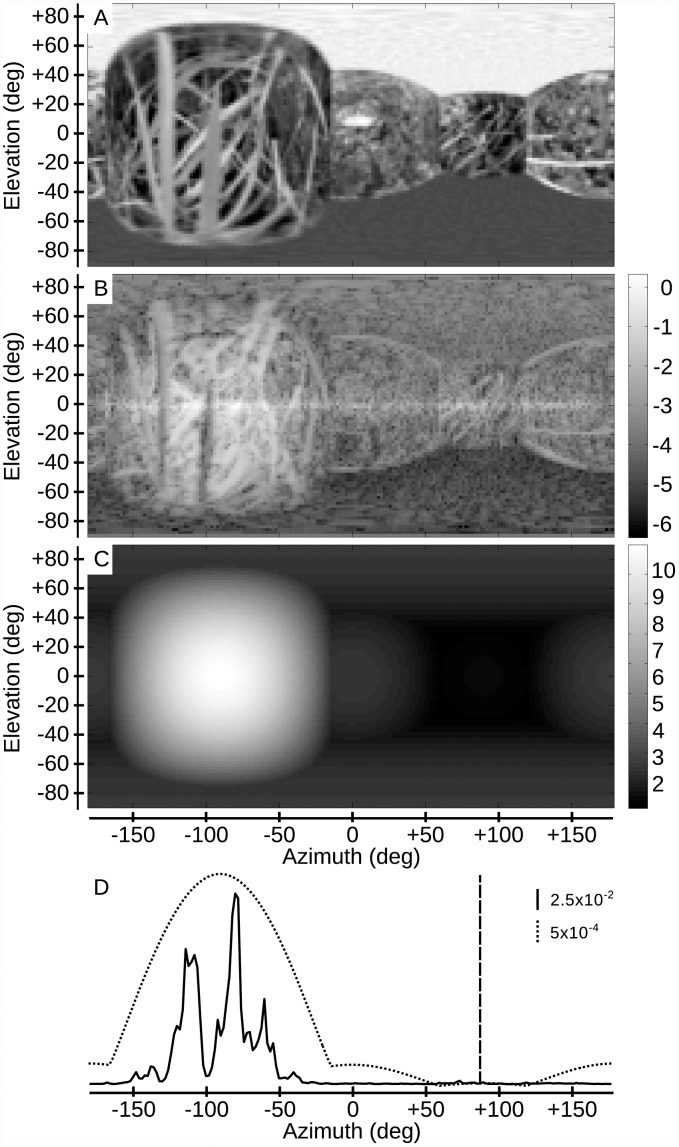
Fig 5. EMD responses and nearness map.
A) Panoramic view of the environment, consisting of a cubic box covered with a natural grass texture, from the location where the nearness map was computed (front is azimuth 0°). B) log-scaled nearness map computed on the basis of EMD responses. C) Nearness map at the same location computed from the geometrical optic flow. D) Vertically integrated nearness map extracted respectively from EMD responses (solid line) and geometrical optic flow (dotted line). The vertical dashed line shows the CAD computed from the vertically integrated nearness map based on EMD responses. The direction matches the one computed with geometrical optic flow.

