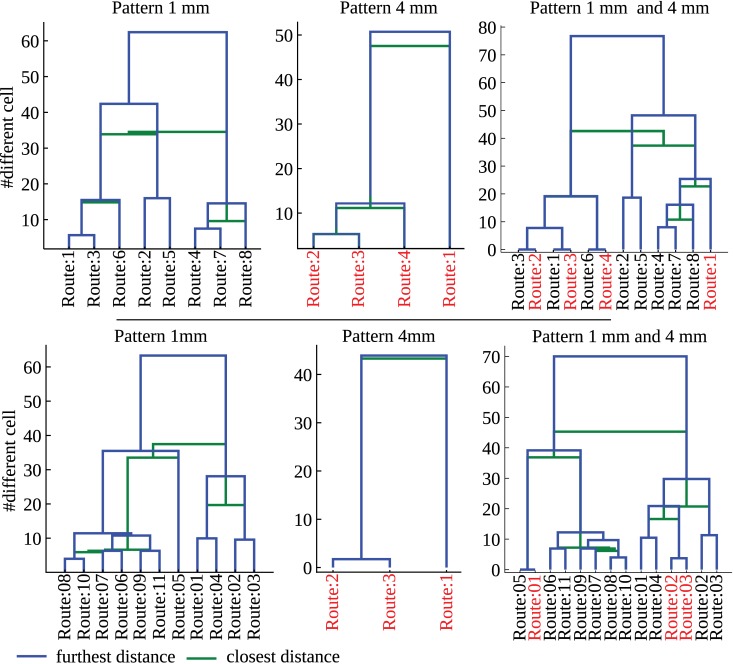
Fig 12. Dendrogramm of route similarity for the two different cluttered environments, top and bottom row, respectively.
The routes followed by the agent (see Fig 9) are characterized by a cell sequence. Here, each cell is a triangle formed by neighboring objects. The route similarity is defined by the number of cells not shared by routes. First and second columns, path-similarity for 1mm and 4mm random checkerboard patterns, respectively. Third column, path-similarity across patterns. Note that identical routes are found for different patterns: for example, route #3 and route #2 in the first environment (top row) are identical to those for the environment covered by 1 mm and 4 mm random checkerboards, respectively. The routes are shown in S12 Fig,S13 Fig,S14 Fig,S15 Fig.

