
Figure 2.
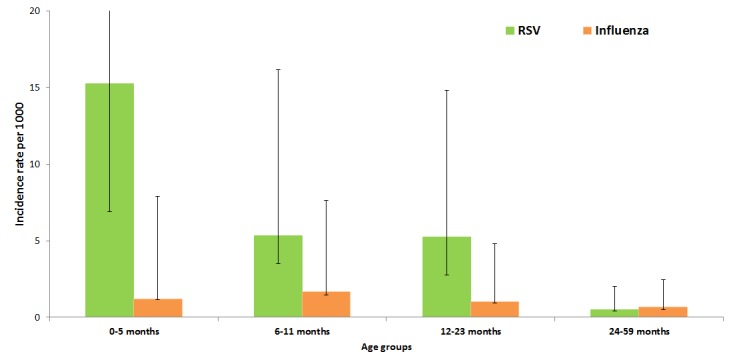
Age–specific incidence rates using all–cause hospitalization for respiratory syncytial virus (RSV) and influenza–associated hospitalization rates in north India (2009–2012). The age groups are on the x–axis and incidence rate of RSV–associated hospitalization per 1000 children denoted on the y–axis. Green and orange colored bars denote incidence rates of RSV and influenza associated hospitalizations respectively with error bars for 95% confidence intervals.