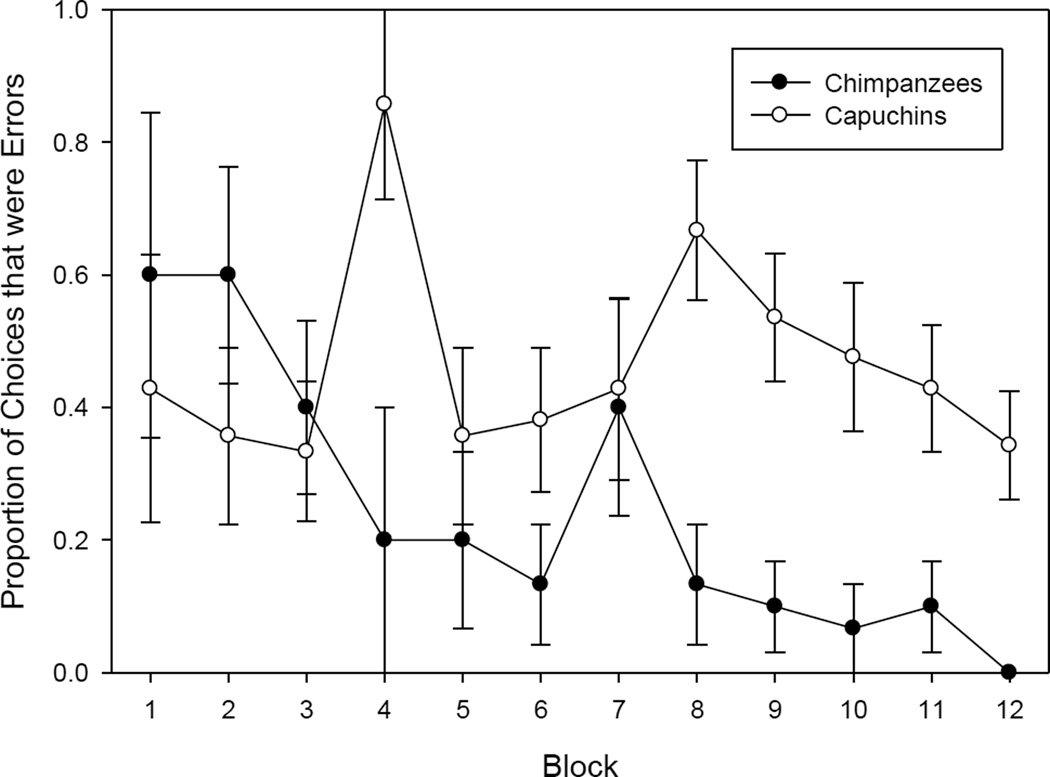
Figure 2.
Proportion of choices that were Errors across blocks (where one block is 16 consecutive mazes). This figure uses a subset of the data (one maze per subject per time point) (see text for explanation). Bars indicate the standard error of the mean (SEM). Note that in this subset of the data, in Blocks 1 – 3, all correct choices are Obvious. Non-obvious choices first appear in Block 4 in this data set. Capuchins had particular difficulty with these kinds of choices when they initially appeared.

