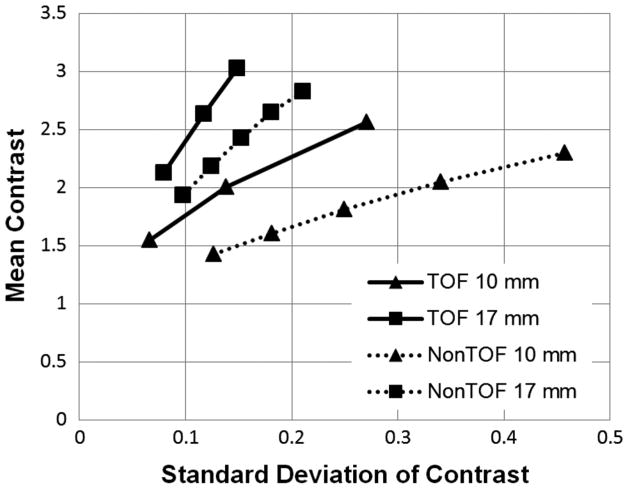
Fig. 11.
Comparison of the mean contrast versus standard deviation of the contrast curves between TOF and non-TOF reconstructions. TOF results are shown by solid lines, while non-TOF results are shown by dashed lines. Square symbols denote the 17-mm sphere and triangle symbols denote the 10–mm sphere.

