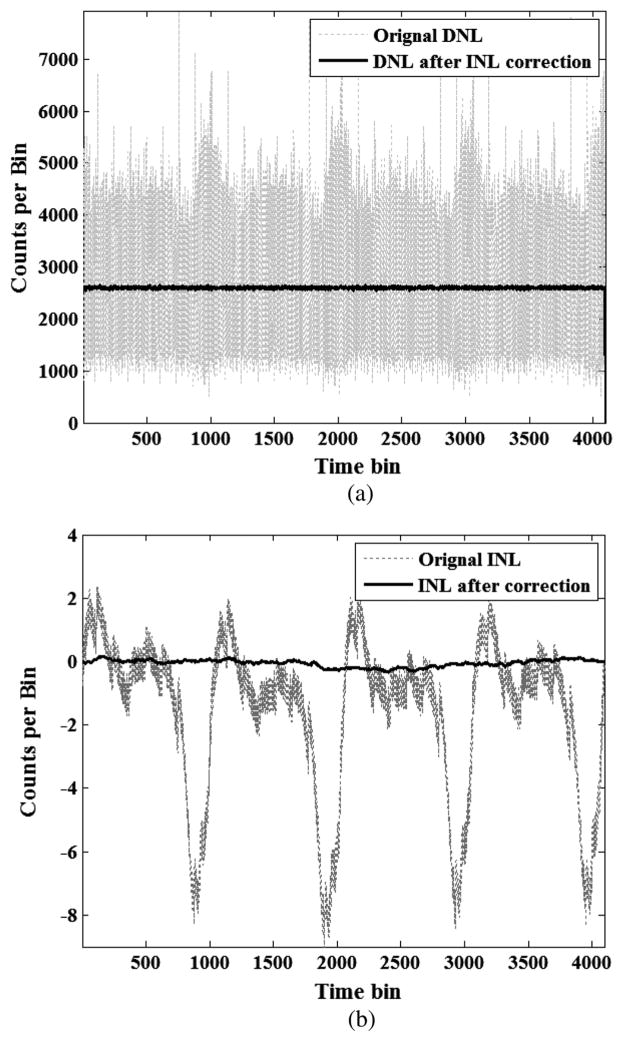
Fig. 5.
Representative (a) DNL and (b) INL curves. The dotted and solid curves are the DNL and INL curves before and after applying INL correction, respectively. The solid curves show that the residual DNL and INL errors are very small after the INL correction. The width of the time bin is 25 ps. Note that we used floating point numbers in the INL correction, so the residual INL errors were less than 1 bit (25 ps).

