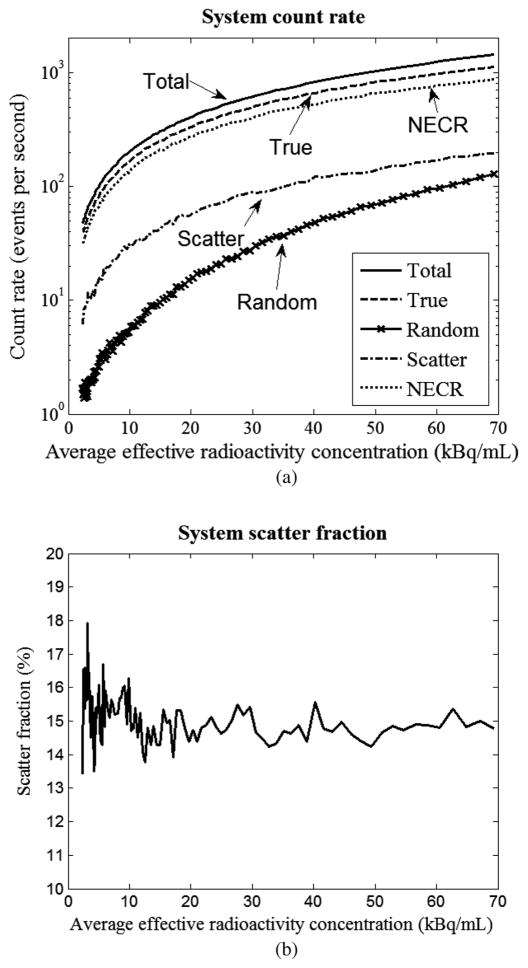
Fig. 9.
(a) The count rates and (b) scatter fractions of the system. In (a), the total count rate, the true count rate, the random count rate, the scatter count rate and NECR are presented by the solid curve, the dashed curve, the solid curve with cross markers, the dash-dot curve and the dotted curve, respectively.

