
Figure 7. Senescence of H1299 cancer cells induced by embonic acid (EA).
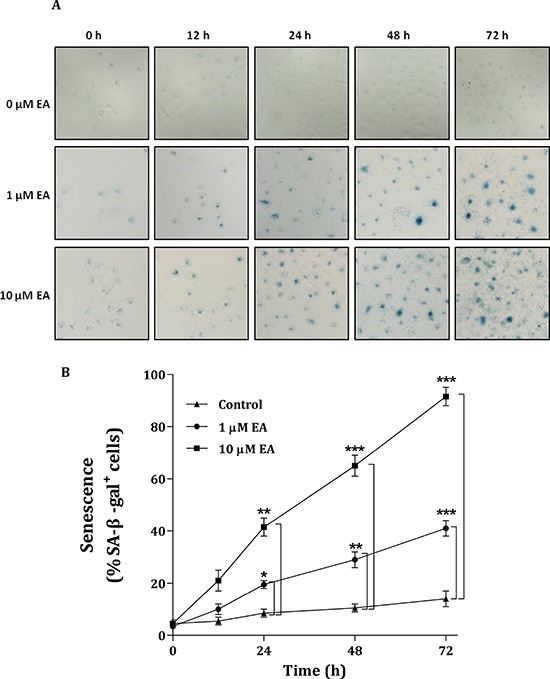
The dose and time dependencies were determined by treating H1299 cells with different concentrations of EA (0, 1 and 10 μM) for different amounts of time (0, 12, 24, 48 and 72 h), respectively. A. Cells were stained with 5-bromo-4-chloro-3-indolyl β-D-galactoside (X-Gal) and detected using the senescence-associated β-galactosidase (SA-β-gal) assay. The image was analyzed by light microscope. B. The percentages of SA-β-gal+ cells were calculated by the number of positively cells per 1,000 cells counted in ten random fields. *P < 0.05, **P < 0.01 and ***P < 0.001.