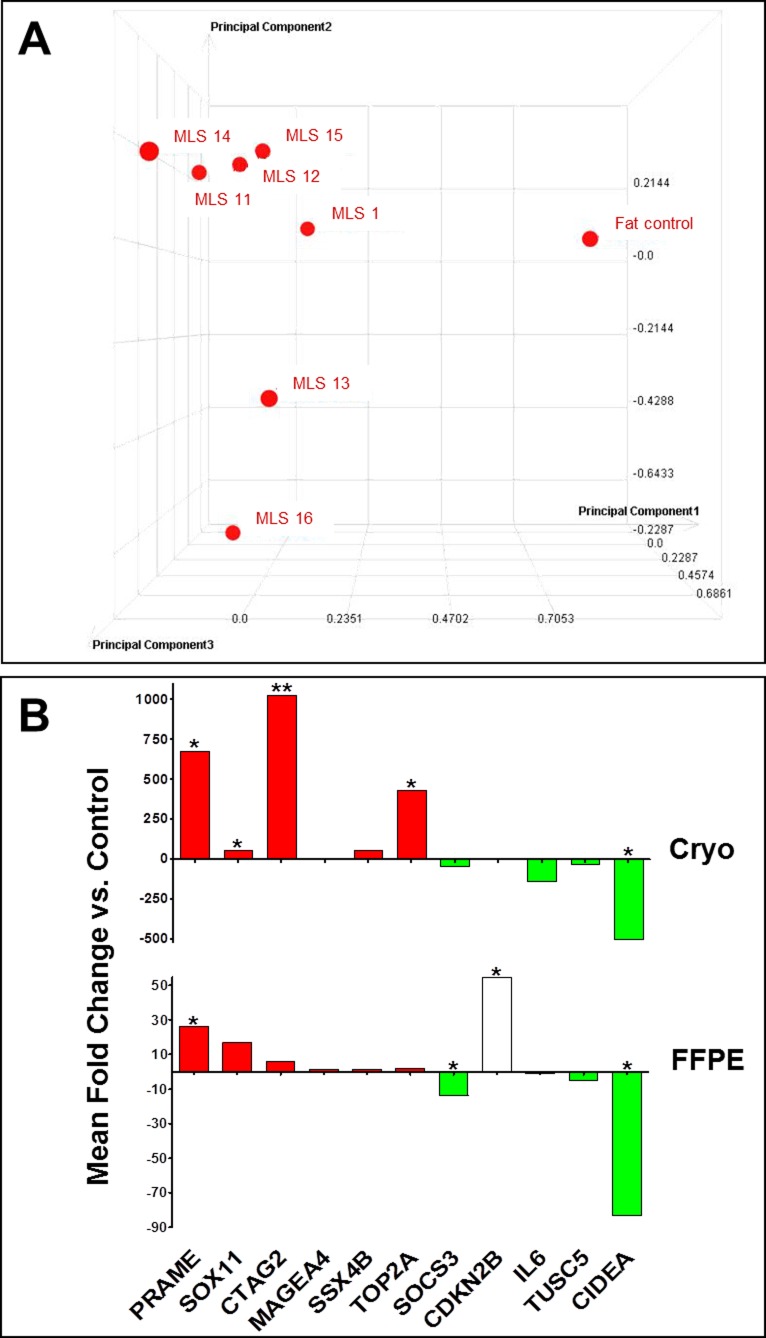
Figure 1. Whole-genome microarray analysis and validation.
A. Three dimensional principal component analysis (PCA) of the gene expression profiles. On X, Y and Z axis arbitrary units for the three different principal components are indicated. Each profile is condensed to a single data point in the three dimensional PCA. The data points' size and distance reflect the three dimensional position within the grid and thus indicate the similarity among the different profiles. B. qPCR validation of selected candidate genes in cryo-conserved (top) and FFPE (bottom) primary tumor samples. Red or green colored bars represent genes with confirmed up- or down-regulation (same expression changes as discovered by microarray analysis previously). Data are represented as analysis output of REST [48] (mean fold change of triplicate measurements). *: p ≤ 0.05; **: p ≤ 0.01; ***: p ≤ 0.001.

