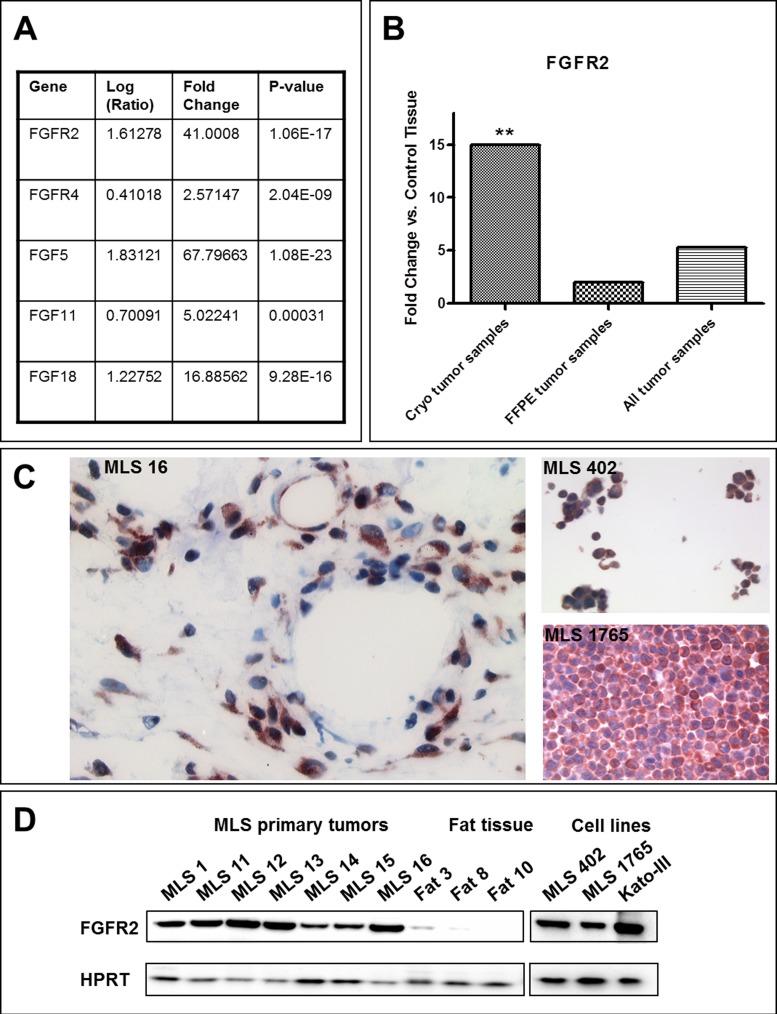
Figure 2. FGFR expression.
A. Differential expression of members of the FGF/FGFR family as detected with the microarray analysis. B. Differential expression of FGFR2 in myxoid liposarcomas detected with qPCR in the whole tumor cohort. Data are represented as analysis output of REST [48] (mean fold change of triplicate measurements). *: p ≤ 0.05; **: p ≤ 0.01; ***: p ≤ 0.001. C. FGFR2 immunohistochemistry in MLS primary tumor tissue (left) and cell lines (right). D. FGFR2 protein expression in cryo-conserved tumor and fat tissue samples as well as in MLS cell lines detected by western blot analysis. Kato-III cells served as positive control for FGFR2 expression.

