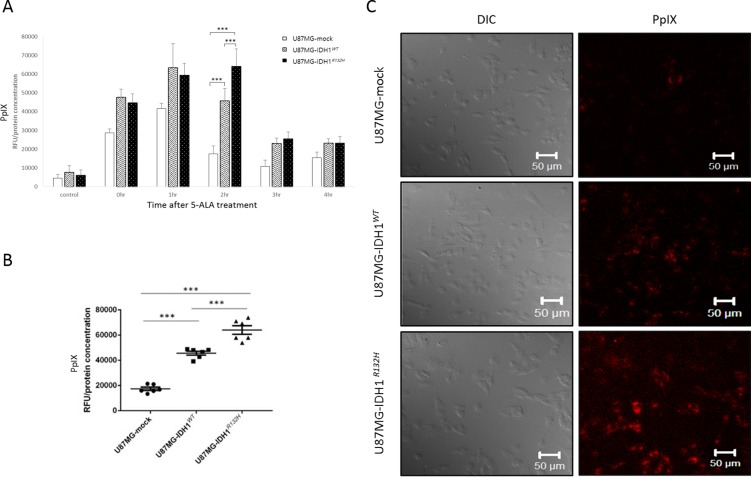
Figure 3. In vitro evidence for an association between IDH1 mutations and 5-ALA fluorescence.
A. PpIX concentrations after 5-ALA treatment, expressed as relative fluorescence units (RFUs) normalized against total cell protein levels. B. Accumulation of intracellular PpIX 2 hours after 5-ALA treatment. C. Confocal laser scanning microscope images taken 2 hours after 5-ALA treatment. PpIX is visible as red fluorescence, located mainly in the cytoplasm. (λex = 405nm, λex > 560nm).

