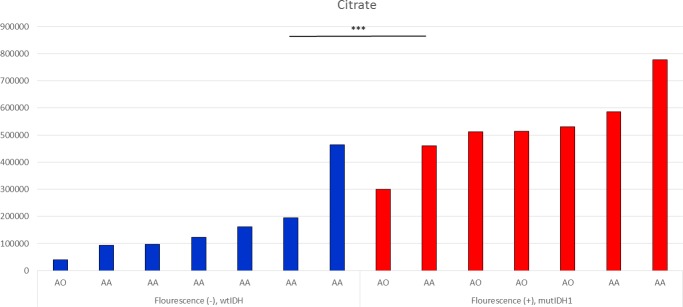
Figure 6. Citrate levels in tumor samples, measured by LC-MS.
All samples were taken after 5-ALA administration and grouped according to optical evidence of intraoperative fluorescence (AA, anaplastic astrocytoma; AO, anaplastic oligodendroglioma). Significant differences were observed between wtIDH1 without fluorescence group and mutIDH1 with fluorescence group (mean value; 167639.8 vs 525871.0, p < 0.001).

