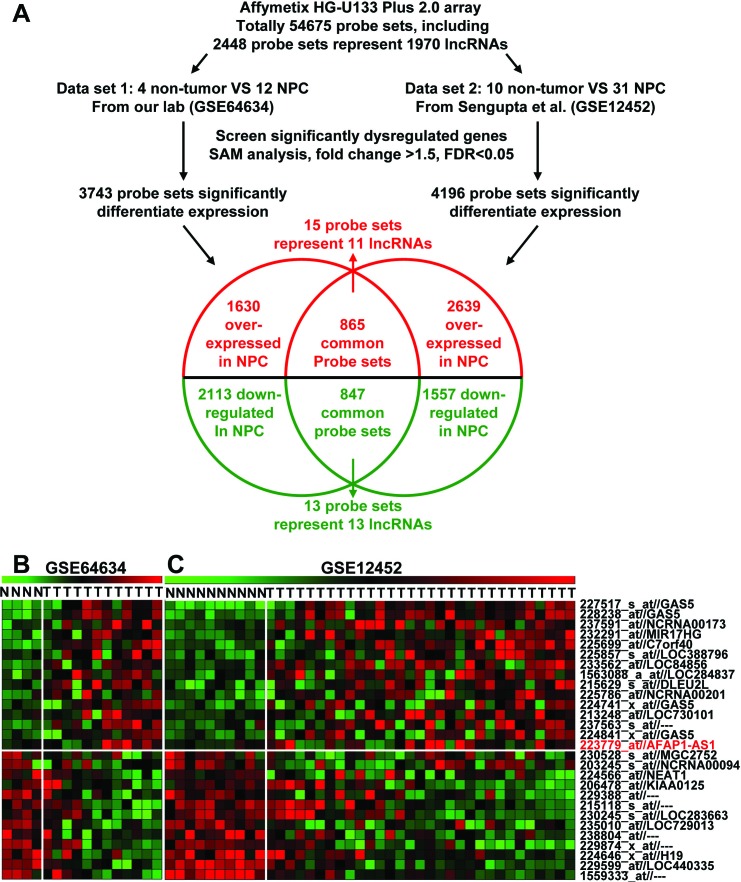
Figure 1. Dysregulated lncRNA expression analysis using two independent NPC cohorts and cDNA microarray analysis.
A. Schematic overview of the workflow used to identify and validate dysregulated lncRNAs in two NPC microarray data cohorts. B. Heatmap of 28 dysregulated probe sets representing 24 lncRNAs mined from our own NPC dataset (GSE64634). C. Heatmap of 28 dysregulated probe sets representing 24 lncRNAs mined from the GSE12452 data set.

