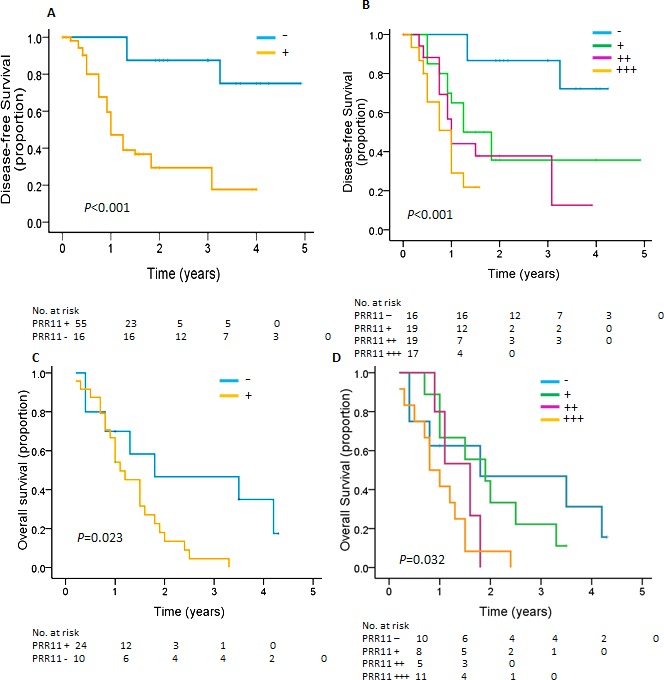
Figure 3. Kaplan-Meier estimates of disease-free survival and overall survival for HC patients according to PRR11.

A. B. Kaplan-Meier curves for disease-free survival for patients with R0 resections are shown according to expression of A. PRR11 status and B. PRR11 expression levels. C, D, Kaplan-Meier curves for overall survival for patients with R1/R2 resections are shown according to expression of C. PRR11 status and D. PRR11 expression levels.
