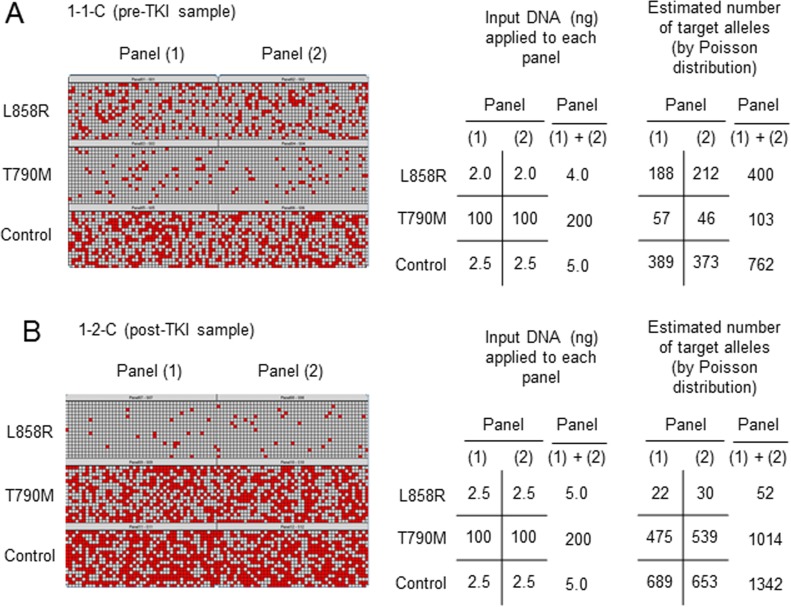
Figure 2. Representative results for quantitative evaluation of T790M by dPCR.
Two samples were obtained from the same patient (no. 1) either before (sample 1-1-C, pre-TKI) (A) or after (sample 1-2-C, post-TKI) (B) EGFR-TKI treatment. The assay was performed in duplicate [panels (1) and (2)]. Chambers with a positive reaction are indicated as red squares in a heat map for each of the 765 chambers, and the number of signals was counted by system software (raw data).

