

Abstract
Ectopic lymphoid-like structures (ELS) are often observed in cancer, yet their function is obscure. Although ELSs signify good prognosis in certain malignancies, we found that hepatic ELSs indicate poor prognosis in hepatocellular carcinoma (HCC). We studied an HCC mouse model, displaying abundant ELSs and found that they constitute immunopathological microniches, wherein progenitor malignant hepatocytes appear and thrive in a complex cellular and cytokine milieu until gaining self-sufficiency. Progenitor egression and tumor formation is associated with autocrine production of cytokines previously provided by the niche. ELSs develop upon cooperation between the innate and adaptive immune system which is facilitated by NF-κB activation and abolished by T cell depletion. These aberrant immune foci could be new targets for cancer therapy.
A central feature of tissue inflammation is the interaction between resident cells and immune cells. Cellular infiltration usually entails a diffuse influx of immune cells, scattered throughout the inflamed tissue. However, infiltrating leukocytes often form simple lymphoid aggregates or even more complex structures that histologically resemble lymphoid organs1, 2. These structures direct various B and T cell responses, possess organization of an appropriate microarchitecture and are referred to as ectopic lymphoid-like structures (ELS). ELSs often develop at sites of chronic inflammation where they influence the course of many diseases including distinct autoimmune, cardiovascular, metabolic and neurodegenerative diseases2. Although the presence of ELSs within inflamed tissues has been linked to both protective and deleterious outcomes in patients, the mechanisms governing ectopic lymphoid neogenesis in human pathology remain poorly defined. In cancer, for example, solid tumors such as colorectal, lung, breast and skin carcinomas, the presence of tumor-associated ELSs correlates with a better prognosis3, 4, 5, 6. It is believed that ELSs may coordinate endogenous antitumor immune responses that improve patient survival1, 5, 7. A role for ELSs in the premalignant phase of tumor growth has not been explored so far.
Hepatocellular carcinoma (HCC) is a major health problem, being the second leading cause of cancer-related deaths worldwide8. In most cases, human HCC is driven by chronic liver inflammation due to chronic viral hepatitis and non-alcoholic steatohepatitis (NASH)9, 10. Formation of hepatic ELSs is a prominent pathological hallmark of chronic viral infection11, 12, yet a functional role for these immune follicles in HCC pathogenesis has not been suggested or explored. Here we report that ELSs are associated with a poor prognosis in human HCC. Furthermore, we present a mouse model displaying abundant hepatic ELSs prior to the appearance of frank HCC nodules, for investigating the pathophysiological relationship between ELSs and tumor development. ELSs form cytokine rich microniches in which HCC progenitors thrive before gaining independence and moving out of the niches to from full blown HCCs. Interrupting ELS function abrogates HCC formation.
RESULTS
ELSs depend on NF-κB and signify poor prognosis in human HCC
To assess the relationship between hepatic ELS prevalence and prognosis in human HCC, we quantified the numbers of ELSs in the non-neoplastic liver parenchyma in a well-characterized cohort of 82 patients having undergone HCC resection, for which we had obtained clinical data, histological slides and gene expression data of the liver parenchyma13. ELS prevalence was histologically assessed in 66 cases (the subset of cases with H&E-stained slides), using a published quantification scale14 (Fig. 1a and Supplementary Fig. 1a). This analysis revealed that in contrast to colon, breast, lung and skin cancers3, 4, 5, 6, a high histological ELS score was associated with increased risk for late recurrence and a trend towards decreased overall survival after HCC resection (Supplementary Fig. 1b–d).
Figure 1. Hepatic ELSs signify a poor prognosis in human HCC and are associated with NF-κB activation.
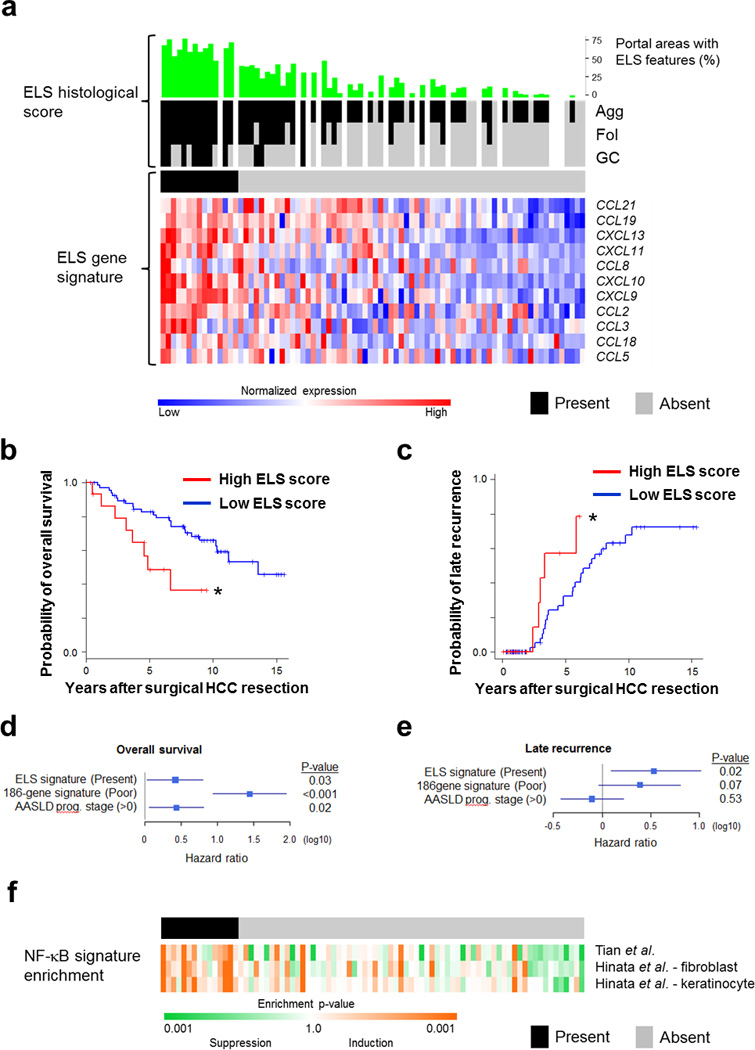
(a) Upper panel, histological ELS score: For each human sample (n=82) the percentage of portal areas with ELS features (green) and the type of ELS was evaluated histologically (black and grey colors indicate presence and absence of histological ELS, respectively; Agg= Aggregate, Fol=Follicle, GC=Germinal Center). Gaps indicate lack of H&E-stained slides. Lower panel, ELS gene signature: Heatmap for expression of each of the 12 genes composing the ELS gene signature6. Presence of high ELS gene signature is shown in the black color bar above the gene expression heatmap. Presence of high ELS gene signature was determined by coherent overexpression of the signature genes with statistical significance (prediction confidence p<0.05), as described in the Methods (black – present, grey – absent; upper horizontal bar). Cases in upper and lower panels are ordered according to ELS gene signature. (b,c) Kaplan Meier curves for survival (b) or late recurrence (c) after resection of HCC, in patients with high (red) and low (blue) ELS gene signatures in the liver parenchyma [n=82 patients (15 high score, 67 low score); *p=0.01 and 0.03 for (b) and (c), respectively, Log-rank test]. (d,e) Hazard ratios of the ELS gene signature for overall survival (d) and late recurrence (e) in multivariable Cox regression modeling adjusted for 186-gene prognostic HCC risk13 and American Association for Study of Liver Diseases (AASLD) prognostic stage40. Bars - 95% confidence interval. (f) Heatmap for NF-κB signature enrichment in the same cohort of human patients as in (a). NF-κB signature enrichment was determined by modulation of 3 experimentally defined sets in HeLa cells, primary human fibroblasts and keratinocytes (see Methods for details). In all 3 panels, samples are ordered according to the extent of ELS signature induction from left to right (same order as in a).
A 12-gene signature was shown to accurately assess the presence of ELSs in human tissues1. Using expression data available for these patients, we found a strong correlation between the histological ELS score and the 12 gene ELS signature (Fig. 1a, p<0.001), confirming its utility in the liver and enabling us to expand the analysis to include all 82 patients with transcriptome profiles. Fifteen out of 82 patients (18%) presented the ELS gene signature in the liver parenchyma (Fig. 1a), which was significantly associated with poor survival of HCC patients after curative surgical resection (Fig. 1b, p=0.01) and increased risk of late, but not early recurrence (Fig. 1c and Supplementary Fig. 1e; p=0.03 and p=0.34, respectively). Of note, multivariable analysis showed that the ELS gene signature is an independent prognostic factor from the 186-gene prognostic - HCC risk gene signature previously identified in this cohort13, as well as the clinical prognostic staging system (Fig. 1d,e). Late recurrence, occurring 2 years after surgery, is considered to represent de novo carcinogenesis from the inflamed liver, while early recurrence occurring within 2 years of surgery results from dissemination of primary tumor cells15. Collectively, our clinical cohort analysis suggested that ELSs are associated with de novo HCC development in chronically inflamed and fibrotic or cirrhotic human livers.
The mechanisms underlying ELS formation in general and in cancer in particular are mostly obscure2, 16. To identify signaling pathways that could initiate or facilitate ELS development in HCC, we performed gene set enrichment analysis (GSEA) comparing gene expression in the liver parenchyma between patients with high vs. low ELS gene signatures. This analysis highlighted the interferon response and NF-κB signaling as top candidates (Supplementary Table 1). Further analysis of the correlation between activation of NF-κB signaling and hepatic ELSs using 3 different published NF-κB signatures confirmed the association for NF-κB (Fig. 1f and Supplementary Fig. 1f). These findings suggest that activation of the I kappa B kinase (IKK)-NF-κB signaling pathway could be an important mediator of hepatic ELS generation.
Persistent IKK activation in hepatocytes induces ELSs
In order to examine the contribution of NF-κB signaling to generation of ELS and HCC, we developed an animal model. To activate the IKK-NF-κB signaling pathway in hepatocytes, we bred R26StopFLIkk2ca mice17 with Albumin-cre (Alb-cre) mice18. The resulting IKKβ(EE)Hep mice express constitutively active IKKβ(EE) in hepatocytes (Fig. 2a) and show nuclear NF-κB and transcriptional activity comparable in their amounts to Mdr2−/− (also known as Abcb4−/−) mice, a model of chronic hepatitis19, but lower than TNF treated mice (Supplementary Fig. 2a–d), suggesting that IKKβ(EE)Hep mice display a level of innate immune activity which is similar to that present in common forms of chronic hepatitis. The livers of 3 month old IKKβ(EE)Hep mice lacked overt histopathology (Supplementary Fig. 2e). At 7 months IKKβ(EE)Hep mice revealed mild increases in liver macrophages, liver damage markers and hepatocyte proliferation (Supplementary Fig. 2f–k). Importantly, multiple ELSs were apparent in livers of 7 month old IKKβ(EE)Hep mice, gradually growing in both size and number (Fig. 2b,c). Immunohistochemical staining revealed that ELSs were composed of T and B lymphocytes, neutrophils (located in the ELS periphery), NK cells, macrophages, T regulatory (Treg) cells, follicular dendritic cells and contained high endothelial venules, confirming that these were bona fide ELSs (Fig. 2d). We next analyzed ELSs present in the parenchyma of human livers with hepatitis (that were resected for HCC) and compared their immune cell composition to that of hepatic ELSs in IKKβ(EE)Hep mice. Histological analysis revealed that ELSs in IKKβ(EE)Hep mice were highly similar to their human counterparts (Fig. 2d). Flow cytometry of single cell suspensions of mouse ELSs confirmed the immunohistochemical analysis (Fig. 2e and Supplementary Fig. 2l,m). B and T lymphocyte compartmentalization, another characteristic feature of ELSs, was also observed in ELSs in IKKβ(EE)Hep mice and human hepatitis (Supplementary Fig. 2n). Furthermore, the ELS gene signature was significantly upregulated in liver parenchymas of IKKβ(EE)Hep mice compared to control Alb-cre mice (Supplementary Fig. 2o and Supplementary Table 2). Thus, persistent IKK activation in hepatocytes could be a key mediator of hepatic ELS formation in human hepatitis.
Figure 2. Persistent liver IKK activation induces ectopic lymphoid structures.
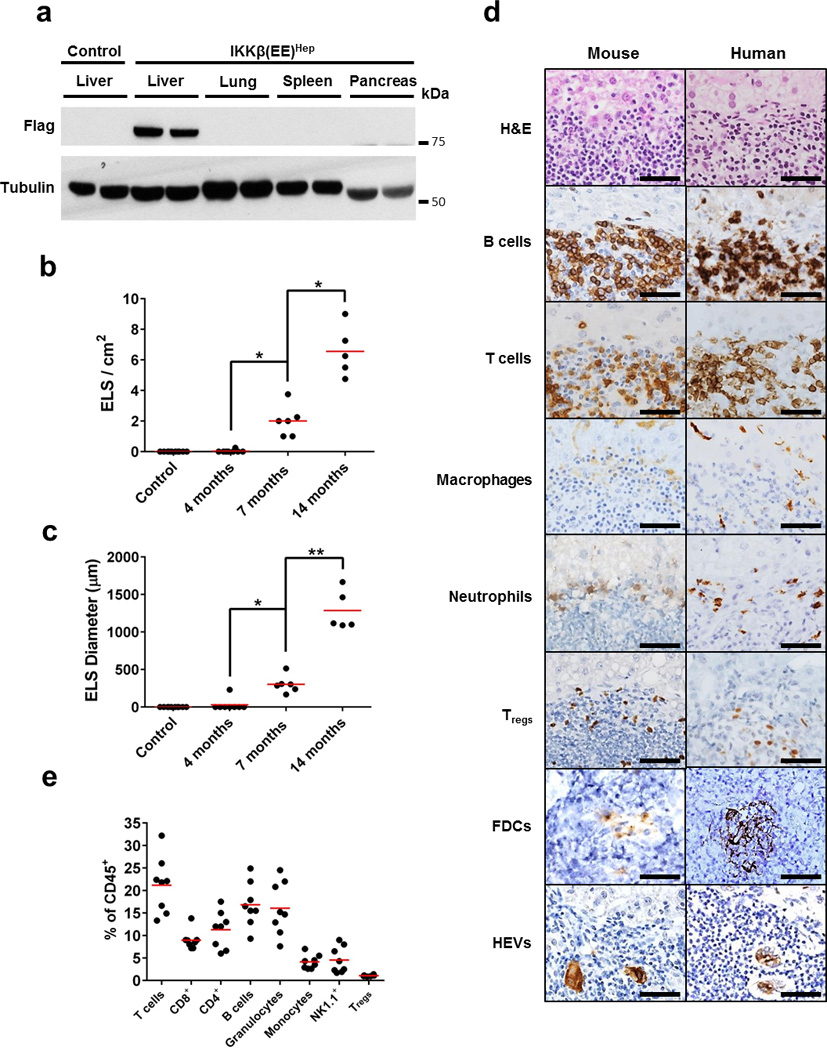
(a) Immunoblot analysis for Flag-tagged IKKβ(EE) in tissues of Alb-cre control and IKKβ(EE)Hep mice. Tubulin - loading control (shown two representative mice per group). (b,c) Quantification of ELS number and size in IKKβ(EE)Hep livers. Control Alb-cre mice do not develop follicles (n=10,8,6,5 for control, 4,7 and 14 months old IKKβ(EE)Hep mice, respectively; *p=0.0002, **p=0.00001, two-tailed Students t-test, red line signifies mean). (d) Representative H&E and immunostained sections of IKKβ(EE)Hep mouse and human livers from patients with chronic hepatitis showing presence of immune follicles (scale bars 50 µm, FDCs, follicular dendritic cells, HEVs, high endothelial venules). (e) Cells from microscopically isolated ELSs from IKKβ(EE)Hep mice livers were analyzed by flow cytometry for markers indicative of the shown cell types (red line signifies mean, results are representative of ELSs isolated from at least 6 IKKβ(EE)Hep mice). Data are representative of three independent experiments in (a) and (d) and of one experiment in (e).
Hepatic ELSs herald aggressive HCCs in IKKβ(EE)Hep mice
At 20 months of age, 100% of IKKβ(EE)Hep mice developed HCC compared to 8% of control Alb-cre mice (Fig. 3a–c, p<0.0001). Histological analysis revealed that approximately half of IKKβ(EE)Hep tumors were well differentiated HCCs (WD-HCC); the remaining tumors were mixed cholangio-hepatocellular carcinomas (HCC-CCC, Fig. 3d), recognized by the presence of malignant glandular structures. Immunostaining for the HCC markers A6 and glutamine synthetase (GS), the proliferation marker Ki-67 and the matrix associated collagen IV (whose expression is downregulated in HCC), and the presence of metastases to lymph nodes and lungs confirmed that these were aggressive malignant HCCs (Supplementary Fig. 3a–c). Notably, mice harboring a single allele of IKKβ(EE) showed decreased ELS number and size at 14 months (Supplementary Fig. 3d,e) followed by a similar decrease in HCC load at 20 months, when compared to mice harboring two such alleles (Supplementary Fig. 3f,g), underscoring an NF-κB dose-dependent ELS phenotype and an association between ELSs and HCC, respectively.
Figure 3. Persistent activation of IKK in hepatocytes induces aggressive HCC.
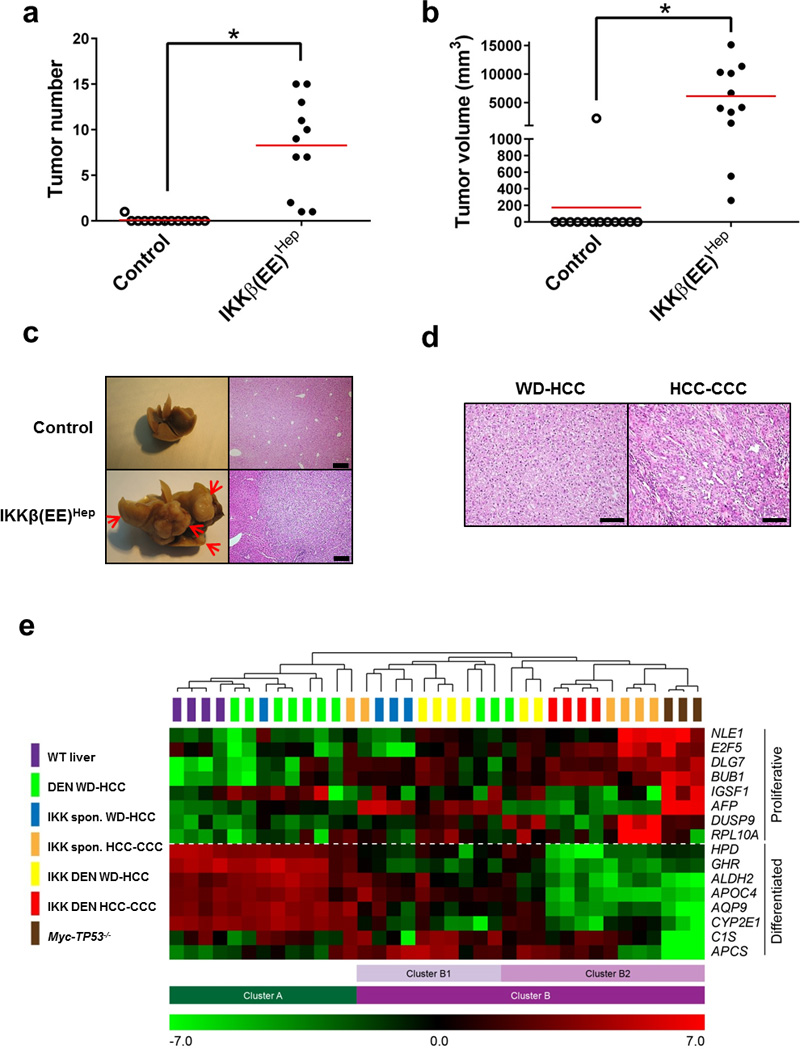
(a,b) Tumor number (≥0.5 cm) and volume in livers of 20-month-old Alb-cre control and IKKβ(EE)Hep mice (n=13,11 for control and IKKβ(EE)Hep, respectively; *p≤0.0002, two-tailed Students t-test, red line signifies mean). (c) Representative livers and H&E stained sections from 20-month-old Alb-cre and IKKβ(EE)Hep mice. Arrows indicate tumors (scale bar- 200 µm). (d) Representative H&E stains of HCCs from 20-month old IKKβ(EE)Hep mice. WD-HCC= well-differentiated HCC, CCC= cholangiocellular carcinoma (scale bar- 100 µm). (e) Heat map representation of relative mRNA expression of a 16-gene HCC proliferation and differentiation signature20 in wild-type (WT) liver parenchyma or HCCs derived from the indicated mice (for further details see Methods). Clusters were determined by an unsupervised algorithm and designated A, B, the latter further subdivided into B1 and B2. Note that DEN induced HCCs from WT mice are more similar to WT liver parenchyma than IKKβ(EE)Hep, most of which fall into cluster B together with the aggressive HCCs of Myc-TP53−/− mice. Statistical analyses of tumor types in the different clusters: DEN WD-HCCs vs. all IKK HCCs (cluster A vs. B) p=6.0E-05; DEN WD vs. IKK DEN tumors (both WD and HCC-CCC tumors) (A vs. B) p=0.001; DEN WD-HCCs vs. IKK spontaneous (spon) HCCs (both WD-HCCs and HCC-CCC tumors) (A vs. B) p=0.04; DEN WD-HCCs -IKK HCC-CCC (A vs. B) p=0.006; IKK WD-HCCs vs. IKK HCC-CCC (B1 vs. B2) p=0.007. n=4,7,8,8,3 for WT, DEN treated Alb-cre, DEN treated IKKβ(EE)Hep, untreated IKKβ(EE)Hep and Myc-TP53−/− mice, respectively; All p values were determined by two tailed chi-square test. Data are representative of two independent experiments in (a) and (b) and of one experiment in (e).
We also generated transgenic mice in which IKKβ(EE) is driven by the Albumin promoter [Alb-IKKβ(EE) mice]. Of note, these mice also displayed ELSs and mild inflammation, followed with development of HCC (Supplementary Fig. 3h–j), corroborating the hepatocarcinogenic effect of constitutive IKKβ(EE) expression in hepatocytes in a distinct mouse model. Treating IKKβ(EE)Hep mice with the hepatic carcinogen diethylnitrosamine (DEN) accelerated the appearance of ELSs (now appearing at 3 months), and HCCs (appearing at 9 months), without significantly altering their histological and molecular characteristics (Supplementary Fig. 3k–r).
Analysis of expression of a 16 gene set for assessing HCC aggressiveness20, revealed that HCCs from DEN-treated wild-type mice tended to cluster with wild-type livers, while HCCs from IKKβ(EE)Hep mice clustered with aggressive HCCs from transgenic mice overexpressing Myc in hepatocytes together with germline deletion of TP53 (Myc-TP53−/−, Fig. 3e, 7 out of 10 compared with 2 out of 20, p=0.002, Fisher’s exact test). Tumors displaying the HCC-CCC morphology, which were only detected in the IKKβ(EE)Hep mice and not found in control DEN-treated ones, clustered with the more aggressive group (Fig. 3e). Of note, we could not detect a difference in the gene expression pattern between spontaneous and DEN induced HCCs in IKKβ(EE)Hep mice. Array comparative genomic hybridization (CGH) analyses of HCCs from DEN-treated Alb-cre control (n=12), DEN-treated IKKβ(EE)Hep mice (n=11) and 20-months old IKKβ(EE)Hep mice (n=13) revealed chromosomal aberrations in all HCC samples, confirming their neoplastic nature. Data are stored and available from ArrayExpress (https://www.ebi.ac.uk/arrayexpress/) accession number E-MTAB-3848. Mixed HCC-CCC tumors were more complex than WD-HCC (Supplementary Fig. 3s). To validate the array CGH analysis, we prepared digital PCR probes directed at two genes, Rgs2 and Gab2, targeting the two most common genomic amplifications. This analysis revealed a 90% concordance with results of the array CGH analysis. In addition, analysis of 13 additional IKKβ(EE)Hep HCCs revealed the presence of amplification of Rgs2 gene copy number in 38% and amplification of Gab2 gene copy number in 30% of the HCCs tested (Supplementary Fig. 3t). Taken together, these data confirmed that IKKβ(EE)Hep mice develop aggressive HCCs with a 100% penetrance.
HCC progenitors first appear inside ELSs and later egress
Careful histological analysis revealed that the earliest malignant hepatocytes (noted at 3 and 7 months in DEN-treated and untreated IKKβ(EE)Hep mice, respectively), appeared first within newly-formed ELSs. These malignant hepatocytes were double positive for GFP (expressed from the hepatocyte specific IKKβ(EE) transgene) and E-cadherin, confirming their hepatocyte origin and epithelial phenotype (Fig. 4a), and expressed multiple markers of HCC progenitors including A6, GP73 (GOLPH2), Sox9, CD44v621 and CK19 (Fig. 4b). At these earliest time points, HCC progenitors were largely found in ELSs and not elsewhere in the liver parenchyma (Supplementary Fig. 4a–c). GFP expression proved that these cells were derived from hepatocytes expressing the Alb-cre transgene (Supplementary Fig. 4d). These small clusters gradually grew, initially within ELSs and later on, migrating out to form visible tumors (Fig. 4c and Supplementary Fig. 4e). This histological sequence, of small groups of cells first appearing within ELSs, followed with gradual coalescence of groups of cells within the follicle boundary, which finally grew out into full-blown HCCs, was consistently seen in all IKKβ(EE)Hep mice of appropriate age in both spontaneous and DEN-treated groups (Supplementary Fig. 4f,g). To unequivocally prove the neoplastic nature of the epithelial cells that grew within the ELSs, we used laser capture micro-dissection to collect enriched populations of these cells. Indeed, 3 out of 11 lesions harbored amplification of Rgs2 and 1 out of 11 harbored amplification of Gab2 (Supplementary Fig. 4h), corroborating the neoplastic nature of these lesions and providing a genetic link between the malignant cells that were thriving within the ELSs and HCCs of IKKβ(EE)Hep mice.
Figure 4. HCC progenitors appear in ELSs and progressively egress out.
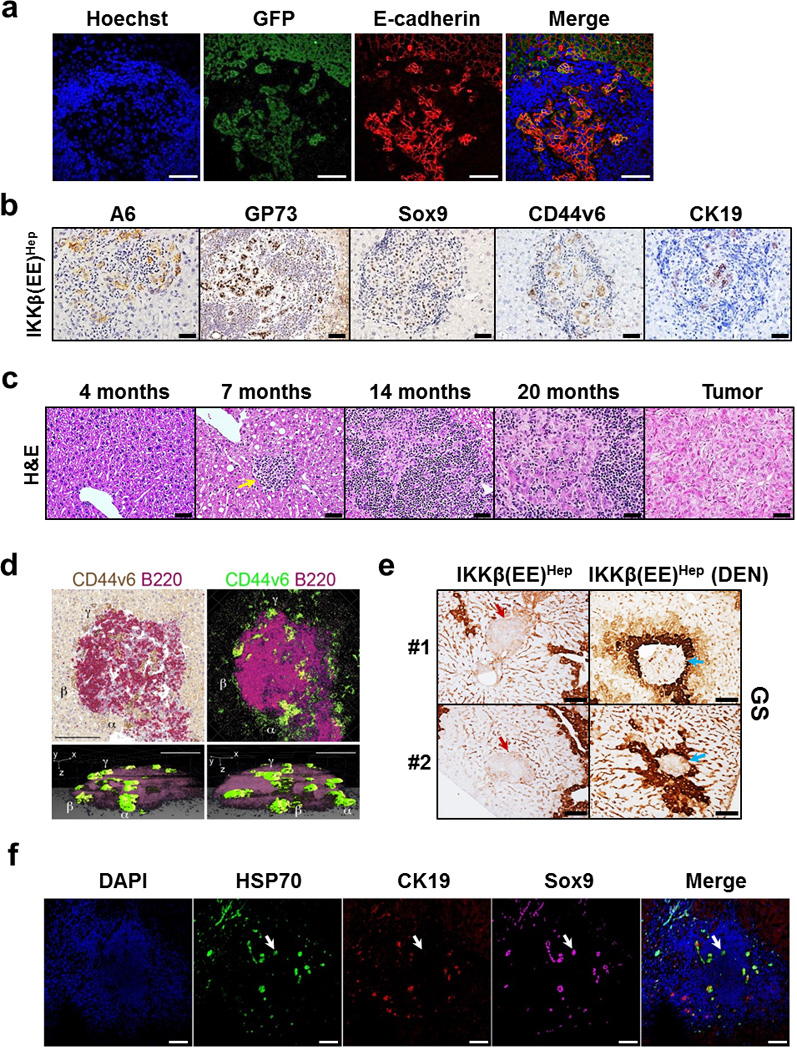
(a) Representative co-immunofluoresence stains for GFP (green) expressed from the hepatocyte specific IKKβ(EE) transgene and the epithelial marker E-cadherin (red) depicting the epithelial origin of HCC progenitors. Hoechst 33342 (blue) marks the nuclei (scale bars 100 µm). (b) Representative immunostains for indicated HCC progenitor markers in ELSs of IKKβ(EE)Hep mice (scale bars 50 µm). (c) Representative H&E stained sections of IKKβ(EE)Hep livers depicting ELS to HCC progression (arrow points to small ELS; scale bars 50 µm). (d) Representative 3-dimensional (3D) reconstruction of an ELS from a 6 month old DEN-treated IKKβ(EE)Hep mouse. Left upper panel: double color immunostaining for CD44v6 (brown) and B220 (red). Right upper panel: color conversion of the left panel (brown to green, red to purple). Lower panels: Two different rotations of a 3D reconstruction. Note green CD44v6+ progenitor cells egressing out of the ELS at multiple points (scale bars 100 µm). α, β and γ show the same region in all panels. See also Supplementary video 1. (e) Representative immunostains of two different livers (#1 and #2) from 14 month old untreated IKKβ(EE)Hep mice and 6 month old DEN treated IKKβ(EE)Hep mice for the pericentral marker glutamine synthetase (GS). Red and blue arrows indicate periportal and pericentral ELSs, respectively. Brown staining highlights pericentral zones (scale bars 100 µm). (f) Representative confocal microscopy images of ELS-containing liver sections from a human patient for the HCC progenitor markers HSP70 (green) and Sox9 (purple) and for the bile duct marker CK19 (red). DAPI (blue) marks the nuclei. Arrow points to a group of HCC progenitors (scale bars 100 µm, arrow points to progenitor cell). Data are representative of three independent experiments in (a) and (b), and of one experiment in (d), (e) and (f).
Of note, several months after the first appearance of ELSs, we consistently observed clusters of malignant hepatocytes budding from the ELSs (Supplementary Fig. 4i). These clusters were either in continuity with or slightly separated from the intra-ELS malignant cells. To better visualize the egression of clusters of malignant cells we co-immunostained serial sections with antibodies against CD44v6 (a marker for HCC progenitor cells21) and B220 and generated 3 dimensional reconstructions of ELSs. The resulting 3 dimensional representations clearly showed clusters of malignant cells budding out of ELSs (Fig. 4d and Supplementary video 1).
Although the IKKβ(EE) transgene is expressed throughout the parenchyma, ELSs are focal, suggesting that additional factors trigger ELS formation. Finding that ELS appearance was accelerated by DEN administration (Supplementary Fig. 3l,m) suggests that tissue damage could be of relevance, either by focal enhancement of hepatocyte NF-κB activation, or by triggering another cooperating pro-inflammatory pathway. To test this possibility we assessed the microanatomical localization of ELSs with respect to different liver zones. DEN is converted to its active metabolite in pericentral hepatocytes. Thus, if genotoxic stress is directly involved in formation of ELSs, the latter will be localized to pericentral regions. Immunostaining with GS (a marker of pericentral hepatocytes) revealed that ELSs were evenly distributed in the 3 liver zones in untreated IKKβ(EE)Hep mice; however, in DEN treated IKKβ(EE)Hep mice ELSs were almost entirely limited to the pericentral zone (Fig. 4e and Supplementary Fig. 4j, p<0.0001), suggesting a causal relationship between genotoxic stress and ELS formation.
To find out if HCC progenitors are also found in ELSs of human patients, we analyzed liver parenchyma from human livers resected for HCC. Triple immunofluorescence with antibodies against the human HCC markers HSP70 and SOX9 together with CK19 (which marks reactive ductular cells), revealed the presence of cells with HCC progenitor features within the human ELSs (Fig. 4f), attesting to a common ELS-related pathogenic mechanism in human HCC and the mouse model.
Depletion of ELSs markedly attenuates murine HCC
The adaptive immune system is commonly considered a defense mechanism against cancer progression; accordingly human HCCs showing marked lymphocytic infiltration were found to have a better prognosis22 and Rag1−/− mice, lacking an adaptive immune system, were shown to have more HCCs after DEN treatment23. Yet, despite its defense function, immune activation can result in various pathologies including cancer24, 25.
To test the functional role of ELSs in hepatocarcinogenesis, we bred IKKβ(EE)Hep mice with Rag1−/− mice which completely lack B and T cells. Consistent with a previous report23, there was a small increase in HCC numbers in DEN treated Rag1−/− mice (Fig. 5a–d). As expected, Rag1 deletion in IKKβ(EE)Hep mice resulted in complete elimination of ELSs. However, in stark contrast with its pro-tumorigenic effect in Rag1−/− mice, loss of the adaptive immune system in IKKβ(EE)Hep -Rag1−/− mice dramatically attenuated hepatocarcinogenesis; most, if not all, of the pro-tumorigenic effect of the IKKβ(EE) transgene was lost in the absence of Rag1 (Fig. 5a–d). Tumors that do develop in Rag1−/− IKKβ(EE)Hep mice were exclusively typical, WD-HCC and were negative for most HCC progenitors markers (Fig. 5e–g). Comparing proliferation, apoptosis and RelA (p65) nuclear accumulation between the HCCs in IKKβ(EE)Hep -Rag1−/− to well differentiated HCCs of IKKβ(EE)Hep mice did not reveal significant differences (Supplementary Fig. 5a–f), arguing against a cell-autonomous effect of Rag1 deficiency on HCC growth. Taken together these data suggest that generation of a focal immune microniche is dependent on a functional adaptive immune system and that the immune microniche promotes HCC.
Figure 5. Adaptive immune cells are required for ELS-dependent HCC promotion.
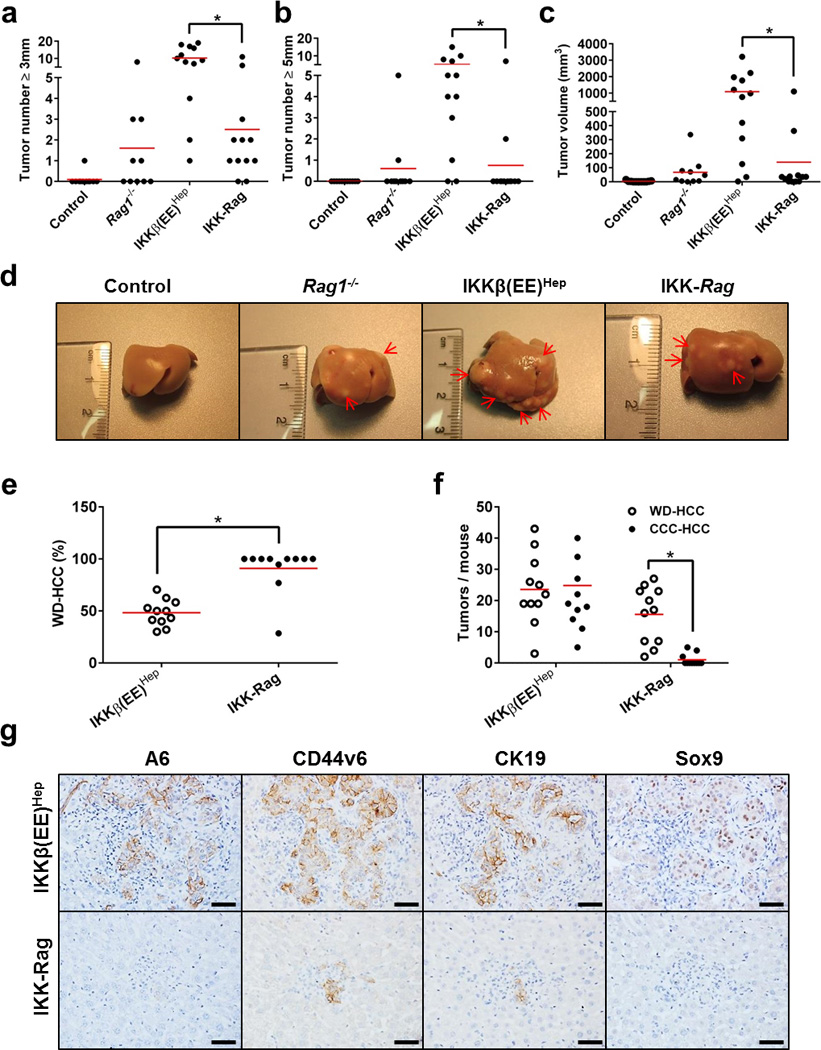
(a,b) Tumor numbers (≥3 mm and ≥5 mm, respectively) and volume (c) in livers of 6 month old DEN-treated Alb-cre control, Rag1−/− , IKKβ(EE)Hep and IKKβ(EE)Hep -Rag1−/− (IKK-Rag) mice (n=11,10,12,12 for control, Rag1−/−, IKKβ(EE)Hep and IKK-Rag, respectively; *p≤0.006, two-tailed Students t-test; red line signifies mean). (d) Representative images of livers from 6-month-old DEN-treated mice. Arrows indicate tumors. (e,f) Tumor quantification by classification to well differentiated HCC (WD-HCC) or mixed cholangio-hepatocellular carcinoma (HCC-CCC). n=11 for each group; *p≤0.00004, two-tailed Students t-test; red line signifies mean. (g) Representative immunostains for the HCC progenitor markers A6, CD44v6, CK19 and Sox9 in 6 month old DEN-treated livers. HCC progenitors in IKKβ(EE)Hep liver are within ELSs, whereas the rare ones occasionally seen in IKKβ(EE)Hep -Rag1−/− mice are in the parenchyma (scale bars- 50 µm). Data are representative of one experiment, n=8.
To test whether ablation of ELS function after induction of tumors by DEN could still affect HCC formation in IKKβ(EE)Hep mice, we administered anti-Thy1.2 antibody, to ablate T cells and potentially also innate lymphoid cells and NK cells which were also reported to respond to anti-Thy1.2 treatment, to mice between 18 to 30 weeks of age. Control mice received an isotype matched control antibody (Supplementary Fig. 6a). Immunostaining livers for CD3 confirmed almost complete T cell ablation (Fig. 6a). Indeed, anti-Thy1.2 treatment restricted ELS development (Fig. 6b), and markedly reduced HCC multiplicity and burden in IKKβ(EE)Hep mice (Fig. 6c–e and Supplementary Fig. 6b–d). Thus, the adaptive immune system plays a strong pro-tumorigenic effect in IKKβ(EE)Hep mice, which takes place after acquisition of the initiating tumor mutations.
Figure 6. Anti-Thy1.2 immuno-ablative treatment during ELS development attenuates liver tumorigenesis.
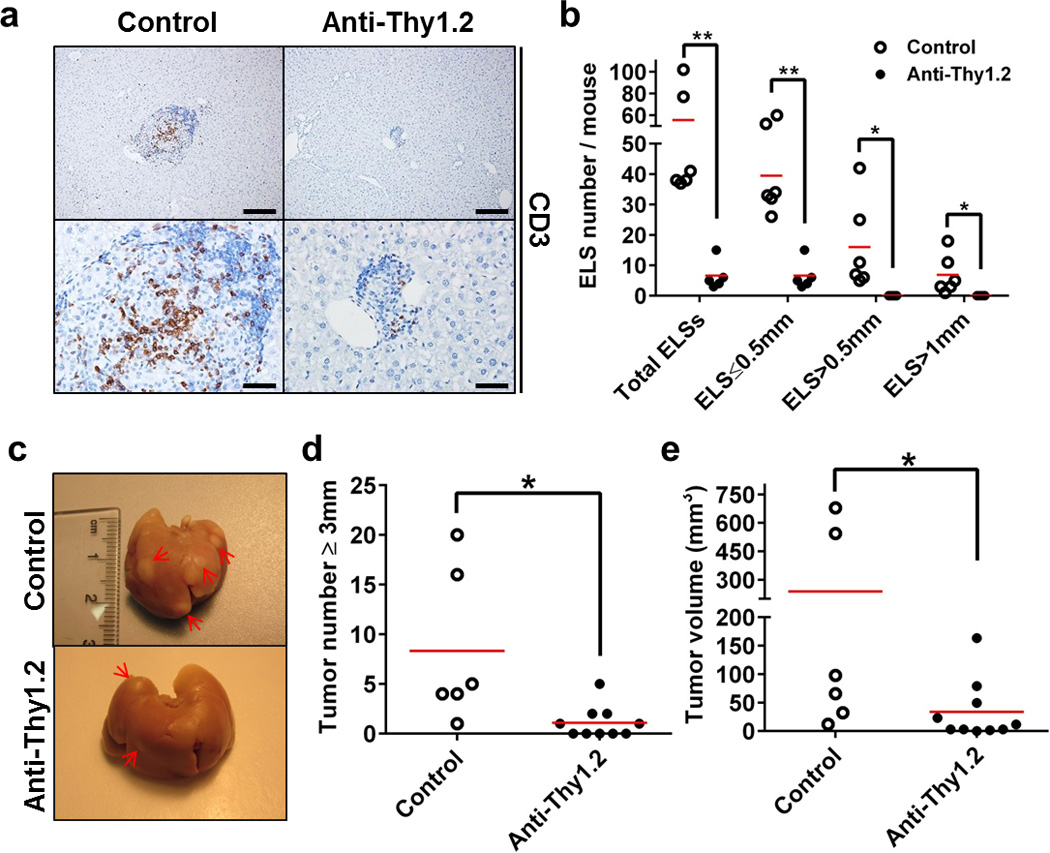
(a) Representative images of immunostaining for CD3 in livers from control or anti-Thy1.2 injected 6 months old DEN-treated IKKβ(EE)Hep mice (n=6, scale bars upper 200 µm, lower 50 µm). (b) Mice were treated with control or anti Thy1.2 antibody. Representative sections from the entire liver were assessed for the total number of ELSs and presence of ELSs of various sizes as indicated (n=6,5 for control or anti-Thy1.2, respectively; *p≤0.04, **p≤0.003, red line signifies mean) (c) Representative images of livers from control or anti-Thy1.2 injected 6-months-old DEN-treated IKKβ(EE)Hep mice. n=6,10 for control and anti-Thy1.2, respectively; arrows indicate tumors. (d,e) Tumor number (≥3 mm) (d) and volume (e) in livers of control or anti-Thy1.2 injected 6-month-old DEN-treated IKKβ(EE)Hep mice (n=6,10 for control and anti-Thy1.2, respectively; *p≤0.04, two-tailed Students t-test, red line signifies mean). Data are representative of one experiment.
ELSs express high amounts of growth promoting cytokines
We hypothesized that cytokines secreted by adaptive immune cells possibly present at high concentrations within ELSs, could underlie their tumor-promoting effects. To identify protumorigenic signals operative within ELSs, we measured expression of multiple cytokines in liver parenchyma, ELSs and HCCs from IKKβ(EE)Hep mice and in human chronic viral hepatitis. Among others, Lymphotoxin (LT) family members, in particular LTβ and LIGHT (also known as TNFSF14), and their downstream effectors, CCL17 and CCL20, were prominently overexpressed in human and mouse samples, along with signs of LT-driven non-canonical NF-κB pathway activation (Fig. 7a,b and Supplementary Fig. 7a–d). LTβ is also expressed in ELSs of patients with chronic hepatitis (Fig. 7b,c). Moreover, we noted a significant correlation between CCL17 and CCL20 mRNA expression and that of LTβ in both human and mouse samples (Supplementary Fig. e-h). This suggests that Lymphotoxin β receptor (LTβR) activation by LTα, LTβ and/or LIGHT could play a key role in ELS assembly and pro-tumorigenic processes26, 27, 28, 29. LTβR was reported to be expressed on hepatocytes, whereas LTα and LTβ are normally expressed in lymphocytes30. Indeed, mRNA in situ hybridization revealed that LTβ mRNA was expressed in immune, but not epithelial cells in small ELSs (Fig. 7d and Supplementary Fig. 7i). To identify the specific cell types which express LTβ, we used flow sorting of single cell suspensions from ELSs. This analysis revealed the LTβ mRNA was expressed by both T and B lymphocytes, but not by hepatocytes (Supplementary Fig. 7j). However, in advanced large ELSs, some of the neoplastic hepatocytes also expressed LTβ and all full-blown HCCs always express LTβ mRNA by histology (Fig. 7d and Supplementary Fig. 7i). Notably, when varying degrees of expression were noted in malignant hepatocytes within an ELS, LTβ mRNA expression occurred in malignant hepatocytes at the ELS periphery, in particular within the egressing clusters (Fig. 7e,f and Supplementary Fig. 7k,l). This raised the hypothesis that immune cells within the ELSs provide paracrine LT signals to early HCC progenitors, which are later replaced by an autocrine signal, allowing the malignant hepatocytes to gain independence from the niche. This presumption could be supported by the observation that transgenic overexpression of LTα and β in hepatocytes was found to induce HCC26. Importantly, HCCs that developed in IKKβ(EE)Hep mice under anti-Thy1.2-treatment and in IKKβ(EE)Hep -Rag1−/− livers showed marked reduction in LTβ mRNA expression, suggesting that exposure of tumor progenitors at early stages to niche-derived cytokines, renders them addicted to these cytokines, favoring acquisition of autocrine abilities to produce the same cytokines (Fig 7g,h and Supplementary Fig. 7m–p).
Figure 7. ELS microniches provide a rich cytokine milieu.
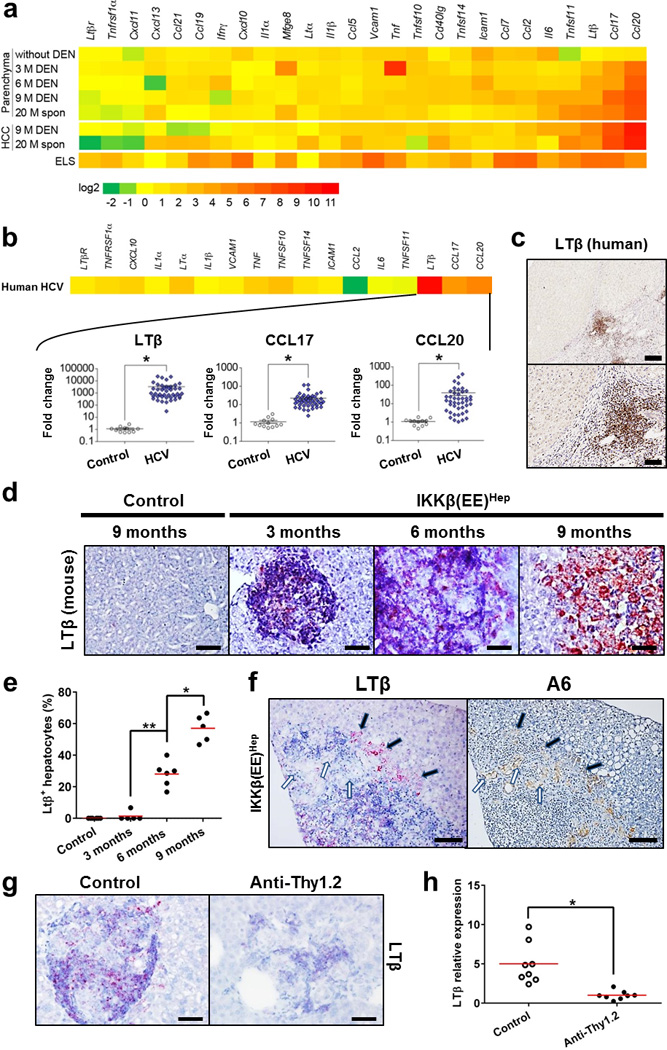
(a) mRNA qPCR analysis of liver parenchyma and HCCs from IKKβ(EE)Hep or DEN-treated IKKβ(EE)Hep mice (M=months of age), as well as in liver parenchyma of 3 month old IKKβ(EE)Hep mice without DEN treatment. Each data point reflects the median expression, normalized to the mean expression of the same gene in control livers derived from the equivalent Alb-cre control mice (for further details see Supplementary Tables 3, 4 & 5). (b) Heat map (upper) and scatter plot (lower) representations of mRNA qPCR analyses of liver tissue from HCV-infected patients (n=43) relative to healthy controls (n=12). Scatter plots depict mRNA amounts of LTβ, CCL17 and CCL20 (for further details see Supplementary Tables 5 & 6; *p<0.0001, two-tailed Students t-test, Log10 scale, cross line signifies mean). (c) Representative immunostaining for LTβ in HCV-infected human liver (scale bars: upper 200 µm; lower 50 µm). (d) Representative LTβ-mRNA in situ hybridization in mouse livers (scale bars 50 µm). (e) Quantification of LTβ expression in malignant hepatocytes. The % of LTβ positive hepatocytes was determined by counting 10 ELSs from each mouse (n=8,5,6,5 for control, 3, 6 and 9 months old mice, respectively; *p=0.0003, **p=0.00006, two-tailed Students t-test, red line signifies mean). (f) Representative serial sections showing LTβ mRNA in-situ hybridization and immunostaining for the progenitor marker A6. Note LTβ staining of immune cells and egressing hepatocytes (black arrows) but not niche residing ones (white arrows, scale bars-100 µm). (g) Representative images of LTβ-mRNA in-situ hybridization in hepatic ELSs of control or anti-Thy1.2 injected 6 month old DEN-treated IKKβ(EE)Hep mice (scale bars-50 µm). (h) qPCR analysis of LTβ mRNA expression in liver parenchyma of control or anti-Thy1.2 injected 6 month old DEN-treated IKKβ(EE)Hep mice (n=10,6 respectively; *p=0.003 two-tailed Students t-test, red line signifies mean). Data are representative of one experiment in (a) and (b) and of two independent experiments in (c), (d), (f) and (g).
To test this hypothesis we blocked LT cytokines using a soluble LTβR fused to a murine immunoglobulin Fc portion (LTβR-Ig)26. Furthermore, to denote the time point of when LT blockade had the most efficient biologic effect, we subjected IKKβ(EE)Hep mice to three treatment regimens: 3–12 weeks of age, when LTβ is expressed by ELS immune cells; 13–22 weeks of age, when LTβ is expressed by both immune and malignant ELS cells; and 23–32 weeks of age during which LTβ is expressed similarly to the intermediate period, yet HCCs are more developed (Supplementary Fig. 8a,b). Measurements of expression of multiple cytokines in liver parenchyma showed reduction in many of the pro-inflammatory and of the LT-mediated cytokines (Fig. 8a). Of note, blocking LT signaling was associated with reduced NF-κB activation in ELS-residing malignant hepatocytes (Supplementary Fig. 8c,d), suggesting that LT signaling enhanced the low level of NF-κB activation induced by the IKKβ(EE) transgene. Remarkably, LTβR-Ig treatment in early and intermediate periods dramatically reduced HCC burden (Fig. 8b and Supplementary Fig. 8e,f). In contrast, LTβR-signaling inhibition at the late period resulted in a smaller, non-significant effect on HCC number and tumor volume. As LT inhibition proved ineffective in reducing tumorigenesis beyond 23 weeks of age, we hypothesized that the major inhibitory effect of LT-blockade could have been in ELSs where LT is primarily provided by the lymphocytes rather than in an autocrine manner by niche-external tumor cells. Indeed, histological inspection of early tumorigenesis stages in the late treatment group revealed a marked reduction in the number of intra-ELS HCC progenitors, and in both multiplicity and size of clusters of egressing cells (Fig. 8c,d and Supplementary Fig. 8g). This was associated with reduced proliferation of HCC progenitor cells in ELSs upon treatment (CDC47+Sox9+ doubly-labeled cells, Fig. 8e–g), possibly accounting for a lower number of ELS-egressing atypical hepatocytes (Fig. 8c,d). It thus appears that paracrine LT stimulation within ELSs is a critical step in HCC development, amenable to anti-tumor intervention.
Figure 8. Blocking LT signaling abolishes microniche egression and tumorigenesis.
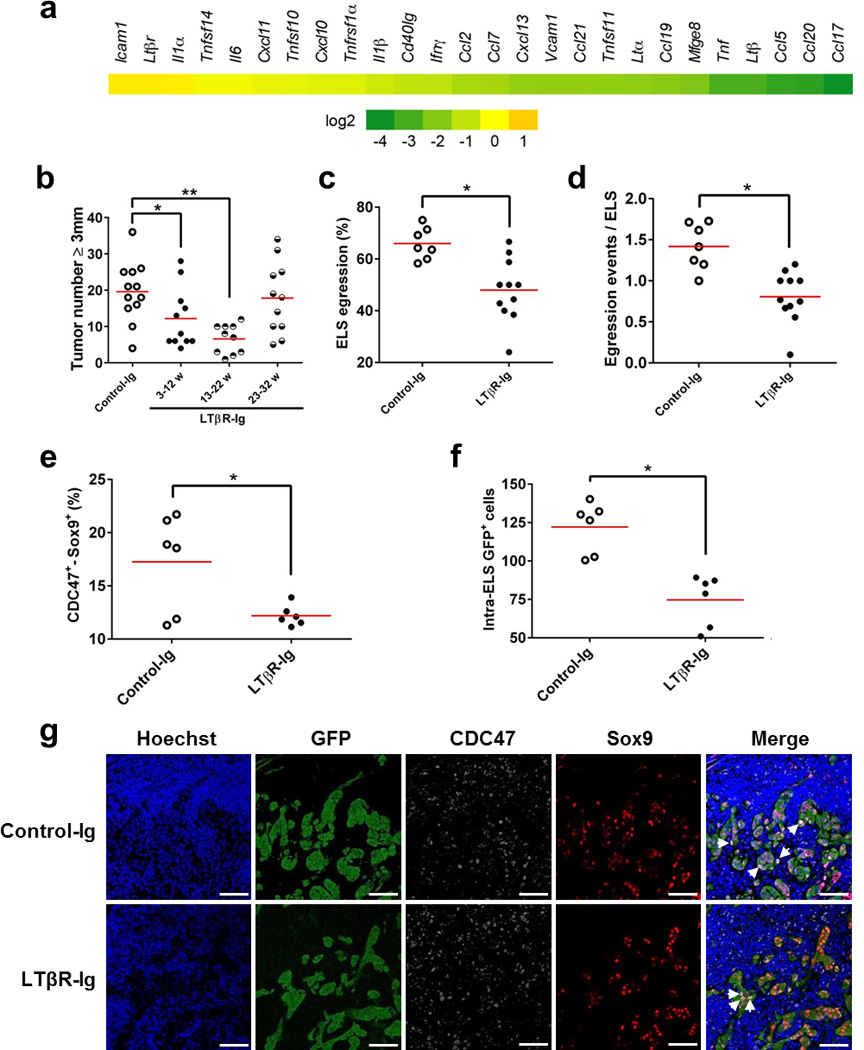
(a) Heat map representation of mRNA qPCR analysis of liver parenchyma from 33-weeks-old IKKβ(EE)Hep mice treated with LTβR-Ig for 10 consecutive weeks (23–32 weeks, see Supplementary Fig. 8a). Each data point reflects the median expression, normalized to the mean expression of the same gene in equivalent control murine-IgG1-injected IKKβ(EE)Hep mice (Log2 scale; See Supplementary Tables 4 & 5). (b) Tumor number (≥0.5 cm) in livers of 33 week old IKKβ(EE)Hep mice treated with either control-Ig or LTβR-Ig for the indicated periods (n=12,11,10,11 for control, 3–12w, 13–22w or 23–32w, respectively; *p=0.04, **p=0.0002, two-tailed Students t-test, red line signifies mean). (c,d) Quantification of the percent of ELSs showing egressed progenitor hepatocytes (c) and of the number of egressing hepatocyte clusters per ELS (d) [n=7,11 for control-Ig and LTβR-Ig treated mice, respectively; *p=0.02, and 0.00009 for (c) and (d), respectively; two-tailed Students t-test, red line signifies mean]. (e) Quantification of the CDC47+Sox9+ double positive cells in ELSs (see below, pink in g, right panels) (n=6; *p=0.02, two-tailed Students t-test, red line signifies mean). (f) Quantification of the GFP+ cells inside the ELSs (n=6; *p=0.001, two-tailed Students t-test, red line signifies mean). (g) Representative confocal microscopy images of ELS-containing liver sections from DEN-treated IKKβ(EE)Hep mice injected for 10 consecutive weeks (23–32 weeks) with control-Ig or LTβR-Ig for GFP, CDC47 and Sox9. Hoechst 33342 marks the nuclei. Arrows indicate CDC47+Sox9+ double positive cells in pink (scale bars 100 µm). Data are representative of one experiment in (a) and (b) and of two independent experiments in (g).
DISCUSSION
Our study reveals a liver tumorigenesis program wherein specialized ELSs, associated with chronic NF-κB activation, foster atypical hepatocytes, that eventually acquire malignant properties. Importantly, our study indicates that ELSs - which are commonly present in human livers with HCC - promote rather than counteract tumor development as was previously demonstrated for several tumor types3, 4, 5, 6, 7. This highlights the existence of contrasting roles of ELSs in cancer that may be related to the different cancer types or perhaps reflect alternative phenotypes of ELSs. Shortly following ELS expansion and tumor progenitor egression, we observe distinct tumors carrying similar chromosomal aberrations, indicating that the tumors originated from ELS-nested atypical hepatocytes. The pro-tumorigenic effect of ELSs requires a competent adaptive immune system, providing lymphocyte-derived cytokines, supporting HCC progenitors until they are ready to egress out of their niches. Related hepatic ELSs are commonly found in chronic hepatitis patients who are at risk of developing HCC, ELSs might constitute a microniche for the population of expanding HCC progenitor cells supporting cancer development. Similarly to our mouse models, these human follicles may form due to constitutive IKK activation by chronic hepatitis virus infection (e.g. HBV31, HCV32, 33). We may have therefore identified a critical window of immune-inflammatory action in tumor development, namely intra-niche growth of early tumor progenitors. The immune microniche environment appears to provide tumor progenitor cells with crucial survival and growth factors. Accordingly, preventing niche assembly or interfering with niche function significantly reduced HCC load in IKKβ(EE)Hep mice. ELSs are unique micro-anatomic structures which are commonly observed in multiple disease states, including cancer2. Specifically in the liver, ELSs are associated with chronic hepatitis11, 12, 34. The IKKβ(EE)Hep model provides for the first time functional information for ELSs, showing that they provide a unique microenvironment supporting growth of tumor progenitor cells. This notion is corroborated by our human studies showing a higher probability of late recurrence and death after HCC resection in patients with high hepatic ELS numbers. Of note, late recurrence, occurring 2 years after surgery, is considered to represent de novo carcinogenesis15.
Although our Rag1−/− experiments confirm previous studies showing that certain adaptive immune cells can play an anti-tumor role in hepatocarcinogenesis (i.e. in the absence of IKK-induced ELS formation), they reveal the dramatic pro-tumorigenic potential of adaptive immune cells in specific forms such as the ELS. An obvious difference between the pro- and anti-tumorigenic states is formation of highly structured microanatomic structures composed of hundreds of immune cells where the dominant effect is pro-tumorigenic. It is becoming clear that in lymphatic organs, three dimensional structures are key for shaping intercellular communication and cooperation among multiple immune cell types, frequently involving physical cell-cell interactions that are meticulously orchestrated to generate multiple effector mechanisms and bestow different phenotypes on the interacting cells35. Thus, the unique structure of the ELS as well as structural and composition changes over time could explain how the adaptive immune system turns from anti- to pro-tumorigenic. One obvious difference is that the compact structure of the ELS, grouping together high numbers of immune cells, likely suffices to generate a niche containing high concentrations of immune derived cytokines and growth factors providing a tumor-promoting environment.
Formation of ELSs is thought to depend on innate lymphoid cells (LTi) that are recruited to extranodal sites by chemoattracting cytokines2. The association between NF-κB activation in human livers and the 100% prevalence of ELSs in IKKβ(EE)Hep livers suggests that activation of hepatocyte NF-κB (known to occur in chronic hepatitis of diverse etiologies) plays a role in ELS formation in the liver, linking instigation of epithelial innate immunity and focal activation of adaptive immunity36. Although NF-κB is activated throughout the liver of IKKβ(EE)Hep mice, ELSs are focal, suggesting that additional cues are needed. Finding that ELS formation is significantly accelerated by DEN suggests that genotoxic stress could play a role in ELS formation. Supporting this notion is the different distribution of ELSs. In untreated IKKβ(EE)hep mice, ELSs are evenly distributed between liver zones, whereas in DEN treated mice, the ELSs are largely located in the pericentral zone where DEN is converted from a pro-carcinogen to a carcinogen that can attack DNA37. This joint activation of the NF-κB and DNA damage response pathways possibly generates a threshold level of cytokines that are sufficient to invoke the formation of ELSs. Of note, although a previous report suggested that a persistently active IKK transgene expressed in hepatocytes did not lead to HCC induction38, it is plausible that either the expression level was not sufficiently high or that the follow up time was not long enough. Indeed, mice harboring a single allele of IKKβ(EE) show diminished tumor load compared with mice harboring two alleles, demonstrating that the level of expression of the transgene is important. Furthermore, we noted HCC development in two different IKK transgenic strains kept in different facilities.
Egression of tumor cells out of the niche where they first grew is a remarkable phenomenon observed in IKKβ(EE)hep mice. Seeds of cancer may germinate in an appropriate microenvironment, yet are capable of leaving the nursing niche and form full-blown malignant tumors only upon acquiring new capabilities. We speculate that acquisition of niche-independence is a hallmark prerequisite of solid tumors initiated within a supportive niche. One specific mechanism we detected in IKKβ(EE)hep mice is the acquisition of autocrine LT expression, but others are also very likely to take place. Recently, tumor progenitors were shown to respond to IL-6 from resident tissue macrophages, but later acquire autocrine IL-6 signaling that promotes malignant progression21. Identifying additional examples of immune-dependent tumor microniches, as well as their tumor progenitor support and egression mechanisms, might guide effective ways of arresting these processes for therapeutic purposes.
METHODS
Prognostic evaluation of histological ELSs, ELS gene signature, and NF-κB activation in liver tissues from curatively treated HCC patients
Prognostic association of the ELS gene signature was evaluated in genome-wide transcriptome profiles of cirrhotic liver tissues from 82 surgically-treated HCC patients followed for up to 15.6 years (median 7.8 years) reported in our previous study15 (NCBI Gene Expression Omnibus accession number GSE10140). For each patient in the cohort, induction of the ELS gene signature was determined by Kolmogorov-Smirnov statistic-based gene set enrichment assessment39 implemented in a custom analysis code written in R statistical language (www.r-project.org). Significance of the signature gene induction was determined as a prediction confidence p-value (significance threshold p<0.05) based on null distribution of the statistic generated by random permutation of the samples (n=1,000). Prognostic association of the ELS gene signature was assessed by Kaplan-Meier curves, log-rank test, and multivariable Cox regression modeling adjusted for the 186-gene prognostic/HCC risk signature we previously reported and clinical prognostic staging (American Association for Study of Liver Diseases [AASLD] staging system40). No clinical variables were associated with these clinical outcomes.
Correlation between presence of ELSs and NF-κB activation was determined by a modulation of 3 experimentally defined NF-kB target gene signatures in HeLa cells41 and primary human fibroblasts and keratinocytes42 and was evaluated in the same transcriptome dataset of 82 HCC patients. Histological ELS features were determined in 66 out of the 82 patients with H&E-stained slides as previously described: vague follicular aggregation (Agg), definite round-shaped cluster of small lymphocytes without germinal center (Fol), and follicles with definite germinal centers composed of large lymphocytes with clear cytoplasm (GC)14. Each section was observed independently by two reviewers that were blinded to the patients’ data. A consensus score was reached on a multi-head microscope in cases of discordance. Presence of histological ELS was defined as presence of any of the histological ELS features in ≥50% of portal areas for each patient.
Human liver tissue
Human liver biopsy specimens were obtained from the archives of the Institute of Surgical Pathology, University Hospital Zurich (USZ), Switzerland and kept anonymous. The study protocol was approved by the ethical committee of the “GesundheitSEMirektion Kanton Zurich” (Ref. Nr. StV 26–2005 and KEK-ZH-Nr. 2013-0382) and was in accordance with the Helsinki declaration guidelines. Additional De-identified surgically resected human liver tissues were obtained via Mount Sinai Biorepository (IRB approval HS10–00135).
Mice, HCC induction and anti-Thy1.2 and LTβR-Ig treatments
All animal experiments were performed in accordance with the guidelines of the Hebrew University, University of California, San Diego (UCSD) and NIH for the use of animals for research. Previously described ROSA26-LSL-IKKβ(EE) mice17 were bred with Albumin (Alb)-Cre mice18 obtained from Jackson Laboratory (Bar Harbor, Maine, stock # 003574) to generate IKKβ(EE)Hep mice. Alb-cre mice served as controls for IKKβ(EE)Hep mice. Alb-IKKβ(EE) mice were generated at the transgenic mouse facility at UCSD as follows: HA-tagged IKKβ(EE) cDNA43 was PCR-amplified and inserted into a plasmid containing 2.3 kb mouse Alb gene enhancer/promoter, rabbit β-globin second intron, rabbit β-globin polyadenylation signal and SV40 early gene polyadenylation signal (provided by Dr. K. Kohno, Nara Institute of Science and Technology, Nara, Japan)44. The expression cassette was excised, purified, and injected into fertilized C57BL/6 oocytes to generate founder mice, three of which transmitted the IKKβ(EE) transgene. Rag1−/− mice were purchased from Jackson Laboratory (stock # 002216), and Mdr2−/− mice have been described previously19. All mice were of a pure C57BL/6 genetic background and were bred and maintained in specific pathogen-free conditions. Only male mice were used. Animals were sacrificed by a lethal dose of anesthesia and perfused through the left ventricle with heparinized PBS followed by buffered formalin.
For hepatocarcinogenesis, mice were injected intraperitoneally (i.p) with 10 mg/kg DEN (Sigma) at 15 days of age. Mice were observed for development of tumors at 9 months of age. To inhibit LTβR-signaling, a murine LTβR: immunoglobulin G1 fusion protein (LTβR-Ig, Biogen Idec), was used. Mice were i.p injected on a weekly basis with 100 µg of LTβR-Ig or MOPC21 (control murine-IgG1) for 10 consecutive weeks, starting either at 3 weeks of age (denoted early: 3–12), 13 weeks (intermediate: 13–22), or 23 weeks (late: 23–32). Mice were sacrificed at 33 weeks of age to evaluate HCC development (Supplementary Fig. 8a).
Anti Thy1.2 treatment: mice were injected IP every 2 days for 12 weeks with Thy1.2 antibody (BioXCell, catalog#: BE0066) or LTF-2 antibody for the control group (BioXCell, catalog#: BE0090). Mice were sacrificed at the age of 6.5 months.
Myc-TP53−/− liver tumors were kindly provided by Marie-Annick Buendia (Institut Pasteur, France). Briefly, woodchuck hepatitis virus (WHV)/Myc transgenic mice were mated with p53−/− mice to generate mice heterozygous for both the p53 mutation and the Myc transgene. The WHV/ Myc p53+/delta mice spontaneously developed HCC, which frequently acquired a deletion of the remaining p53 allele. HCCs were further genotyped. Myc-TP53−/− HCCs were used as reference for a highly proliferative liver cancer in the 16-gene array analysis.
Serum alanine transaminase (ALT) and aspartate aminotransferase (AST) levels were determined using Reflotron Plus analysis system (Roche).
Examination of mouse H&E sections was performed by three expert liver pathologists (A.W, O.P. & E.P).
Immunohistochemistry (IHC), Immunofluorescence and 3D reconstruction
Antibodies used were directed against: A6 (provided by Valentina Factor and Snorri Thorgeirsson, NIH, USA); B220 (BioLegend clone RA3–6B2); CD3 (Serotec clone CD3–12 or ZYTOMED, cat# RBK024); GFP (Invitrogen cat# A-11122); F4/80 (Serotec clone CI:A3-1); Ly-6G (BD Pharmingen, cat# 551459); FDC-M1 (BD Pharmingen clone # FDC-M1); Glutamine Synthetase (GS) (Abcam cat# ab16802); GP73/ GOLPH2 (Santa Cruz cat# sc-48011); Foxp3 (eBioscience clone FJK-16s); Ki67 (Thermo Scientific Clone SP6); CDC47 (MCM7) (Santa Cruz, cat# sc-56324); RelA (p65) NeoMarkers catalog #RB-1638); CD44 (eBioscience clone IM7); CD44(V6) (eBioscience clone 9A4); Sox9 (Santa Cruz cat# sc-20095); CK19 [hybridoma TROMA-III, deposited to Developmental Studies Hybridoma Bank (DSHB) by Kemler Rolf]; Collagen IV (Cedarlane Laboratories cat# CL50451AP); E-cadherin (BD clone 36/E-cadherin); Cleaved Caspase 3 (Cell Signaling cat# 9661). Antigen retrievals for B220, GFP, Ki67,CDC47, E-cadherin, RelA, Sox9, CK19 and Cleaved Caspase 3 were performed in 25mM citrate buffer pH 6.0; for GP73, Ly-6G, GS, Collagen IV, Foxp3, CD44, CD44(V6) and CD3 in EDTA buffer pH 8.0 (Invitrogen) – all by heating to 125°C for 3 min in decloaking chamber (Biocare Medical). Antigen retrieval for A6 and F4/80 was performed by incubation with 1mg/ml Pronase XXIV (Sigma). Immunofluorescence was performed on FFPE sections. Fluorophore conjugated secondary antibody used were Donkey anti-Mouse Cy5, Donkey anti-Rat Cy3 (Jackson Immunoresearch) and Alexa-Fluor Donkey anti-Goat 488 (life technologies). Hoechst 33342 (Invitrogen) was used as a nuclei marker.
Antibodies used for human sections were: CD3 (Cell Marque cat# 103A); CD15 (Biocare Medical, cat# CM029); CD20 (Cell Marque cat# 120R); CD23 (Novacastra Labs clone # 1B12); CD68 (Invitrogen clone KP1); Foxp3 (eBioscience clone # 236A/E7); HSP 70 (Santa Cruz, cat# sc-24) and LTβ (Biogen clone B27.B2). IHC staining of human sections was performed with BenchMark XT system (Ventana) using Cell Conditioning 1 (CC1, Ventana) for pretreatment, besides Foxp3 which was stained manually using EDTA buffer pH 8.0 (Invitrogen) for retrieval.
For quantification, stained slides were counted either manually by counting the number of positive cells per 10 high-power fields, or quantified with an Ariol SL-50 automated scanning microscope and image-analysis system (Applied Imaging). Briefly, the frequency of positive cells was assessed with the appropriate module of the Ariol SL-50. For each sample, the percentage of positive cells or the intensity of the staining was determined in 10, arbitrary chosen, fields. Three dimensional reconstruction of ELSs in the liver was done using the µCore software (microDimensions GmbH, München, Germany) using a Mirax Midi Slide Scanner (Carl Zeiss microImaging GmbH, München, Germany) as described45.
Immunoblot (IB) and electrophoretic mobility shift assay (EMSA)
Antibodies used for IB: Actin (Sigma clone AC-40); FLAG (Sigma clone Anti-Flag M2); p100/p52 (Cell Signaling cat #4882); RelB (Milipore cat # 06–1105); Tubulin (Sigma clone DM-1A). To prepare whole-cell lysates, tissues were lysed by mechanical grinding in RIPA buffer (50mM Tris-HCl pH 7.4, 150mM NaCl, 1mM EDTA, 1% NP-40 and 0.25% Na-deoxycholate) containing 1x mixture of protease inhibitors (Sigma), 10mM Na3VO4, 10mM Na4P2O7 and 50mM NaF. Total cell lysates were separated by SDS-PAGE and assessed by IB analysis, using sequential probing with the indicated primary Ab and an appropriate anti-IgG conjugated to HRP (Jackson). Immunoreactive bands were detected using ECL detection reagent (Pierce).
For EMSA, IRDye 700 labeled oligonucleotide (LI-COR Biosciences) corresponding to NF-κB specific consensus sequence was used. The binding reaction was performed using Odyssey Infrared electro-mobility shift assay kit (LI-COR Biosciences) according to the manufacturer protocol. Briefly, nuclear proteins were isolated from freshly isolated liver tissue using Cayman Nuclear Extraction Kit (Cayman Chemical Company) and total protein concentration was determined with the BCA Protein Assay Kit (Thermo Scientific). 20 ng of total nuclear protein was mixed with the labeled NF-κB oligonucleotide and left to bind for 30 minutes in the dark. Protein-DNA complexes were resolved by electrophoresis on 4% polyacrylamide Tris/Borate/EDTA (TBE) gel in the dark. Quantitative data was obtained using computerized densitometer and TINA software [version 2.07d (Raytest)].
RNA in-situ hybridization
RNA in-situ hybridization was performed using the RNAscope 2.0 kit (Advanced Cell Diagnostics) according to manufacturer instructions. Briefly, 4 µm FFPE sections were deparaffinized in xylene and pretreated to allow access of probe to target RNA. LTβ specific probe pairs (Advanced Cell Diagnostics) were hybridized to the target RNA at 40°C in a moist hybridization oven for 2 hours. The signal was amplified using AP-conjugated labeled probes, followed by colorimetric detection using Fast Red as substrate. LTβ mRNA was visualized using standard bright-field microscopy.
Array-based Comparative Genomic Hybridization (aCGH)
Agilent oligonucleotide array based CGH for genomic DNA analysis of FFPE samples (Mouse Genome CGH Microarray 4×44K) was performed on genomic DNA extracted from FFPE liver tissues, according to the protocol provided by Agilent Technologies. Briefly, 500 ng of liver genomic DNA was differentially labeled with Cy3-dCTP (HCC) and Cy5-dCTP (liver tissue from C57BL/6 mice) by random primed labeling (CGH labeling kit for oligo array, Enzo Life Sciences). Liver genomic DNA from C57BL/6 mice was pooled and used as reference DNA. After scanning the array slides, spot fluorescence intensities were extracted using the Feature Extraction Software (Agilent Technologies), and the raw data text files were used for further analysis. The data were imported into the R statistical platform (http//:www.R-project.org/) and data quality outliers were filtered out using the quality flags as implemented in the Feature Extraction software, such as statistical population outliers or spots with foreground to background ratios smaller than 3. The log2 ratios of each sample were collated into one matrix and preprocessed and analyzed as follows, using functions from the Bioconductor R package CGHcall46. Missing values were replaced using the values from neighboring probes by an imputation algorithm whereas probes with missing values in more than 30% of samples were excluded from the dataset. The remaining data were median normalized followed by breakpoint detection using a segmentation algorithm47, and the copy number status (loss, normal and gain) of each segment was determined using the CGHcall function46. The copy number calls of the single probes were transformed into copy number regions using the CGH regions package48 and plotted for each chromosome according to their physical position.
Proliferation/differentiation analysis of Figure 3e
The experimental group and tumor histology is indicated by the color code above each column. Clusters were determined by an unsupervised algorithm and designated A, B, the latter further subdivided into B1 and B2. Note that DEN induced HCCs from WT mice are more similar to WT liver parenchyma than IKKβ(EE)Hep, most of which fall into cluster B together with the aggressive Myc-TP53−/− mice. Statistical analyses of tumor types in the different clusters: DEN WD-HCCs vs. all IKK HCCs (cluster A vs. B) p<0.0001; DEN classic vs. IKK DEN tumors (both WD and HCC-CCC tumors) (A vs. B) p=0.001; DEN WD-HCCs vs. IKK spontaneous (spon) HCCs (both WD-HCCs and HCC-CCC tumors) (A vs. B) p=0.04; DEN WD-HCCs -IKK HCC-CCC (A vs. B) p=0.006; IKK WD-HCCs vs. IKK HCC-CCC (B1 vs. B2) p=0.007. All p values were determined by two tailed chi-square test. Key: WT liver (purple)= parenchymal liver tissue from untreated 6 months old Alb-cre mice; DEN WD-HCC (green)= well differentiated HCCs from 9 months-old DEN-treated-Alb-cre mice; IKK spon. WD-HCC (blue)= well differentiated HCCs from 20 months-old IKKβ(EE)Hep mice; IKK spon. HCC-CCC (light brown)= undifferentiated mixed HCC-CCCs from 20 months-old IKKβ(EE)Hep mice; IKK DEN WD-HCC (yellow)= well differentiated HCCs from 9 months-old DEN-treated- IKKβ(EE)Hep mice; IKK DEN HCC-CCC (red)= undifferentiated mixed HCC-CCC from 9 months-old DEN-treated- IKKβ(EE)Hep mice; Myc-TP53−/− (brown): HCCs from the very aggressive mouse model for HCC, Myc-TP53−/− mice. See Supplementary Table 7 for primers sequence.
FACS and cell sorter
ELSs were dissected under binocular from IKKβ(EE)Hep livers and digested for 30 minutes in 500µl digestion buffer (HBSS with 0.2 mg/ml collagenase IV and 0.1 mg/ml DNase1) at 37°C with gentle agitation. The cells were strained through 40µm filter by washing with cold DMEM, centrifuged for 15 minutes, RBCs were lysed for 10 minutes at 25° with erythrocytes lysis buffer, washed again and resuspended in 0.5ml DMEM and kept on ice for a few hours until staining. Viability of isolated immune cells was around 85% as determined by Trypan blue. Cells were resuspended and stained in PBS supplemented with 1% fetal calf serum and 1mM EDTA. Samples were stained and then analyzed by flow cytometry using a Gallios and Kaluza software (Beckman Coulter), or by fluorescence-activated cell sorter (FACS). Antibodies used for flow cytometry and FACS analysis: CD4 (clone RM-4.5, catalog#: 100536, BioLegend), CD8 (clone 53–6.7, catalog#: 65–0081 and 75–008, Tonbo), F4/80 (clone BM8, catalog#: 123127, BioLegend), CD11b (clone M1/70, catalog#: 101224, BioLegend), MHCII (clone KH74, catalog#: 115303, BioLegend), CD45.2 (clone 104, catalog#: 109807, BioLegend), NK1.1 (clone PK136, catalog#: 12–5941-83, eBioscience), TCRβ (clone: H57–597, catalog#: 35–5961, Tonbo), CD44 (clone IM7, catalog#: 103127, BioLegend), CD62L (clone MEL-14, catalog#: 104417, BioLegend), B220 (Catalog#: 553090, BD Pharmingen).
Quantitative PCR analysis
Total RNA was extracted with Trizol (Invitrogen) and was reverse-transcribed by the high–capacity cDNA reverse transcription kit (Applied Biosystems). qPCR reactions were ran in triplicates in 384-well plates, and were carried out with SYBR green (Invitrogen) in 7900HT Fast Real-Time PCR System (Applied BioSystems). Results were analyzed using either the Dataassist 2.0 or qBase v1.3.5 softwares. HPRT and PPIA were used as reference genes in both human and murine analyses. Primer sequences are available in Supplementary Tables 3, 6 and 7 and expression fold and p-values in Supplementary Tables 2, 4 and 5.
Digital PCR analysis
Genomic DNA was extracted from fresh frozen tissue with DNeasy (QIAGEN, Catalog# 69504) and from FFPE tissue with QIAamp DNA Micro Kit (QIAGEN, Catalog# 56304) and used for digital PCR analysis with the following TAQMAN probes: Rgs2, Gab2 (Applied Biosystems, catalog# AB- 4400291), Tert (Applied Biosystems, catalog# AB-4458368). High-throughput droplet digital PCR for quantitation of DNA copy number was done as described49.
Statistical analysis
Results are expressed as mean ± SEM. Statistical significance (p<0.05) was determined by either two-tailed Student’s t-test, two tailed chi-square test or Fisher’s exact test. For correlation analysis in mRNA expression levels, either Spearman or Pearson correlation tests at p<0.05 were used. Data was processed using Microsoft Excel or GraphPad Prism 6.0.
METHODS
Methods and any associated references are available in the online version of the paper.
Supplementary Material
ACKNOWLEDGMENTS
We thank Einat Cinnamon, Marie-Annick Buendia, Kenji Kohno, Marc Ringelhan, Ruth Hillermann, Daniel Kull, Irit Gat-Viks, Yael Steuerman, Shalev Itzkovitz and Keren Bahar-Halpern for help and advice. Grant support: Dr. Miriam and Sheldon G. Adelson Medical Research Foundation (AMRF) to E.P & Y.B-N; European Research Council (ERC): LIVERMICROENV to E.P, PICHO to Y.B-N and LiverCancerMechanism to M.H; Israel Science Foundation (ISF) to E.P, Y.B-N, I.S & O.P; Helmholtz alliance “preclinical comprehensive cancer center”, Graduiertenkolleg (GRK482) to M.H; Krebsliga Schweiz (Oncosuisse) and Promedica Stiftung to A.W; NIH (CA118165; SRP ES010337; AI0043477) and the Hildyard chair for Mitochondrial and Metabolic Diseases to M.K; Japan Society for the Promotion of Science Postdoctoral Fellowships to K.T; NIH (DK099558), Irma T Hirschl award and Dr. Harold and Golden Lamport award to Y.H; the FLAGS foundation to N.G.; the Uehara memorial foundation to S.N.
Footnotes
ACCESSION CODES
Data for array CGH analysis are stored and available from ArrayExpress (https://www.ebi.ac.uk/arrayexpress/) accession number E-MTAB-3848.
COMPETING FINANCIAL INTERESTS
The authors declare competing financial interests: We have filed for a provisional patent related to this manuscript.
AUTHOR CONTRIBUTIONS
K.R., M.K, M.H, Y.B-N, E.P conceived the study; S.F, D.Y & I.S designed and carried out most experiments and data analysis; K.T, A.W, K.U, N.G, S.N, G.G, ME.S, M.K, H.K, M.B & O.P carried out additional experiments, contributed samples and performed data analysis ; JL.B & K.R supplied novel reagents; S.F, D.Y, I.S, Y.H, M.K, M.H, Y.B-N & E.P wrote the manuscript.
REFERENCES
- 1.Coppola D, Nebozhyn M, Khalil F, Dai H, Yeatman T, Loboda A, et al. Unique ectopic lymph node-like structures present in human primary colorectal carcinoma are identified by immune gene array profiling. Am J Pathol. 2011;179(1):37–45. doi: 10.1016/j.ajpath.2011.03.007. [DOI] [PMC free article] [PubMed] [Google Scholar]
- 2.Pitzalis C, Jones GW, Bombardieri M, Jones SA. Ectopic lymphoid-like structures in infection, cancer and autoimmunity. Nat Rev Immunol. 2014;14(7):447–462. doi: 10.1038/nri3700. [DOI] [PubMed] [Google Scholar]
- 3.Di Caro G, Bergomas F, Grizzi F, Doni A, Bianchi P, Malesci A, et al. Occurrence of tertiary lymphoid tissue is associated with T-cell infiltration and predicts better prognosis in early-stage colorectal cancers. Clinical cancer research : an official journal of the American Association for Cancer Research. 2014;20(8):2147–2158. doi: 10.1158/1078-0432.CCR-13-2590. [DOI] [PubMed] [Google Scholar]
- 4.Dieu-Nosjean MC, Antoine M, Danel C, Heudes D, Wislez M, Poulot V, et al. Long-term survival for patients with non-small-cell lung cancer with intratumoral lymphoid structures. Journal of clinical oncology : official journal of the American Society of Clinical Oncology. 2008;26(27):4410–4417. doi: 10.1200/JCO.2007.15.0284. [DOI] [PubMed] [Google Scholar]
- 5.Gu-Trantien C, Loi S, Garaud S, Equeter C, Libin M, de Wind A, et al. CD4(+) follicular helper T cell infiltration predicts breast cancer survival. J Clin Invest. 2013;123(7):2873–2892. doi: 10.1172/JCI67428. [DOI] [PMC free article] [PubMed] [Google Scholar]
- 6.Messina JL, Fenstermacher DA, Eschrich S, Qu X, Berglund AE, Lloyd MC, et al. 12-Chemokine gene signature identifies lymph node-like structures in melanoma: potential for patient selection for immunotherapy? Scientific reports. 2012;2:765. doi: 10.1038/srep00765. [DOI] [PMC free article] [PubMed] [Google Scholar]
- 7.Di Caro G, Marchesi F. Tertiary lymphoid tissue: A gateway for T cells in the tumor microenvironment. Oncoimmunology. 2014;3:e28850. doi: 10.4161/onci.28850. [DOI] [PMC free article] [PubMed] [Google Scholar]
- 8.Stewart BW, Wild CPe. World Cancer Report. 2014:2014. [Google Scholar]
- 9.El-Serag HB. Hepatocellular carcinoma. The New England journal of medicine. 2011;365(12):1118–1127. doi: 10.1056/NEJMra1001683. [DOI] [PubMed] [Google Scholar]
- 10.Umemura A, Park EJ, Taniguchi K, Lee JH, Shalapour S, Valasek MA, et al. Liver damage, inflammation, and enhanced tumorigenesis after persistent mTORC1 inhibition. Cell Metab. 2014;20(1):133–144. doi: 10.1016/j.cmet.2014.05.001. [DOI] [PMC free article] [PubMed] [Google Scholar]
- 11.Scheuer PJ, Ashrafzadeh P, Sherlock S, Brown D, Dusheiko GM. The pathology of hepatitis C. Hepatology. 1992;15(4):567–571. doi: 10.1002/hep.1840150402. [DOI] [PubMed] [Google Scholar]
- 12.Gerber MA. Histopathology of HCV infection. Clin Liver Dis. 1997;1(3):529–541. doi: 10.1016/s1089-3261(05)70319-6. vi. [DOI] [PubMed] [Google Scholar]
- 13.Hoshida Y, Villanueva A, Kobayashi M, Peix J, Chiang DY, Camargo A, et al. Gene expression in fixed tissues and outcome in hepatocellular carcinoma. The New England journal of medicine. 2008;359(19):1995–2004. doi: 10.1056/NEJMoa0804525. [DOI] [PMC free article] [PubMed] [Google Scholar]
- 14.Murakami J, Shimizu Y, Kashii Y, Kato T, Minemura M, Okada K, et al. Functional B-cell response in intrahepatic lymphoid follicles in chronic hepatitis C. Hepatology. 1999;30(1):143–150. doi: 10.1002/hep.510300107. [DOI] [PubMed] [Google Scholar]
- 15.Hoshida Y, Villanueva A, Llovet JM. Molecular profiling to predict hepatocellular carcinoma outcome. Expert review of gastroenterology & hepatology. 2009;3(2):101–103. doi: 10.1586/egh.09.5. [DOI] [PMC free article] [PubMed] [Google Scholar]
- 16.Drayton DL, Liao S, Mounzer RH, Ruddle NH. Lymphoid organ development: from ontogeny to neogenesis. Nat Immunol. 2006;7(4):344–353. doi: 10.1038/ni1330. [DOI] [PubMed] [Google Scholar]
- 17.Sasaki Y, Derudder E, Hobeika E, Pelanda R, Reth M, Rajewsky K, et al. Canonical NF-kappaB activity, dispensable for B cell development, replaces BAFF-receptor signals and promotes B cell proliferation upon activation. Immunity. 2006;24(6):729–739. doi: 10.1016/j.immuni.2006.04.005. [DOI] [PubMed] [Google Scholar]
- 18.Postic C, Magnuson MA. DNA excision in liver by an albumin-Cre transgene occurs progressively with age. Genesis. 2000;26(2):149–150. doi: 10.1002/(sici)1526-968x(200002)26:2<149::aid-gene16>3.0.co;2-v. [DOI] [PubMed] [Google Scholar]
- 19.Pikarsky E, Porat RM, Stein I, Abramovitch R, Amit S, Kasem S, et al. NF-kappaB functions as a tumour promoter in inflammation-associated cancer. Nature. 2004;431(7007):461–466. doi: 10.1038/nature02924. [DOI] [PubMed] [Google Scholar]
- 20.Cairo S, Armengol C, De Reynies A, Wei Y, Thomas E, Renard CA, et al. Hepatic stem-like phenotype and interplay of Wnt/beta-catenin and Myc signaling in aggressive childhood liver cancer. Cancer Cell. 2008;14(6):471–484. doi: 10.1016/j.ccr.2008.11.002. [DOI] [PubMed] [Google Scholar]
- 21.He G, Dhar D, Nakagawa H, Font-Burgada J, Ogata H, Jiang Y, et al. Identification of liver cancer progenitors whose malignant progression depends on autocrine IL-6 signaling. Cell. 2013;155(2):384–396. doi: 10.1016/j.cell.2013.09.031. [DOI] [PMC free article] [PubMed] [Google Scholar]
- 22.Wada Y, Nakashima O, Kutami R, Yamamoto O, Kojiro M. Clinicopathological study on hepatocellular carcinoma with lymphocytic infiltration. Hepatology. 1998;27(2):407–414. doi: 10.1002/hep.510270214. [DOI] [PubMed] [Google Scholar]
- 23.Schneider C, Teufel A, Yevsa T, Staib F, Hohmeyer A, Walenda G, et al. Adaptive immunity suppresses formation and progression of diethylnitrosamine-induced liver cancer. Gut. 2012;61(12):1733–1743. doi: 10.1136/gutjnl-2011-301116. [DOI] [PMC free article] [PubMed] [Google Scholar]
- 24.Okin D, Medzhitov R. Evolution of inflammatory diseases. Curr Biol. 2012;22(17):R733–R740. doi: 10.1016/j.cub.2012.07.029. [DOI] [PMC free article] [PubMed] [Google Scholar]
- 25.Karin M, Lawrence T, Nizet V. Innate immunity gone awry: linking microbial infections to chronic inflammation and cancer. Cell. 2006;124(4):823–835. doi: 10.1016/j.cell.2006.02.016. [DOI] [PubMed] [Google Scholar]
- 26.Haybaeck J, Zeller N, Wolf MJ, Weber A, Wagner U, Kurrer MO, et al. A lymphotoxin-driven pathway to hepatocellular carcinoma. Cancer Cell. 2009;16(4):295–308. doi: 10.1016/j.ccr.2009.08.021. [DOI] [PMC free article] [PubMed] [Google Scholar]
- 27.Wolf MJ, Seleznik GM, Heikenwalder M. Lymphotoxin’s link to carcinogenesis: friend or foe? from lymphoid neogenesis to hepatocellular carcinoma and prostate cancer. Advances in experimental medicine and biology. 2011;691:231–249. doi: 10.1007/978-1-4419-6612-4_24. [DOI] [PubMed] [Google Scholar]
- 28.Tumanov AV, Koroleva EP, Christiansen PA, Khan MA, Ruddy MJ, Burnette B, et al. T cell-derived lymphotoxin regulates liver regeneration. Gastroenterology. 2009;136(2):694–704. doi: 10.1053/j.gastro.2008.09.015. e694. [DOI] [PMC free article] [PubMed] [Google Scholar]
- 29.Drutskaya MS, Efimov GA, Kruglov AA, Kuprash DV, Nedospasov SA. Tumor necrosis factor, lymphotoxin and cancer. IUBMB life. 2010;62(4):283–289. doi: 10.1002/iub.309. [DOI] [PubMed] [Google Scholar]
- 30.Bauer J, Namineni S, Reisinger F, Zoller J, Yuan D, Heikenwalder M. Lymphotoxin, NF-kB, and cancer: the dark side of cytokines. Dig Dis. 2012;30(5):453–468. doi: 10.1159/000341690. [DOI] [PubMed] [Google Scholar]
- 31.Yun C, Um HR, Jin YH, Wang JH, Lee MO, Park S, et al. NF-kappaB activation by hepatitis B virus X (HBx) protein shifts the cellular fate toward survival. Cancer letters. 2002;184(1):97–104. doi: 10.1016/s0304-3835(02)00187-8. [DOI] [PubMed] [Google Scholar]
- 32.Yu GY, He G, Li CY, Tang M, Grivennikov S, Tsai WT, et al. Hepatic Expression of HCV RNA-Dependent RNA Polymerase Triggers Innate Immune Signaling and Cytokine Production. Mol Cell. 2012 doi: 10.1016/j.molcel.2012.07.032. [DOI] [PMC free article] [PubMed] [Google Scholar]
- 33.Arzumanyan A, Reis HM, Feitelson MA. Pathogenic mechanisms in HBV- and HCV-associated hepatocellular carcinoma. Nature reviews Cancer. 2013;13(2):123–135. doi: 10.1038/nrc3449. [DOI] [PubMed] [Google Scholar]
- 34.Mosnier JF, Degott C, Marcellin P, Henin D, Erlinger S, Benhamou JP. The intraportal lymphoid nodule and its environment in chronic active hepatitis C: an immunohistochemical study. Hepatology. 1993;17(3):366–371. [PubMed] [Google Scholar]
- 35.Qi H, Kastenmuller W, Germain RN. Spatiotemporal basis of innate and adaptive immunity in secondary lymphoid tissue. Annu Rev Cell Dev Biol. 2014;30:141–167. doi: 10.1146/annurev-cellbio-100913-013254. [DOI] [PubMed] [Google Scholar]
- 36.Iwasaki A, Medzhitov R. Regulation of adaptive immunity by the innate immune system. Science. 2010;327(5963):291–295. doi: 10.1126/science.1183021. [DOI] [PMC free article] [PubMed] [Google Scholar]
- 37.Verna L, Whysner J, Williams GM. N-nitrosodiethylamine mechanistic data and risk assessment: bioactivation, DNA-adduct formation, mutagenicity, and tumor initiation. Pharmacol Ther. 1996;71(1–2):57–81. doi: 10.1016/0163-7258(96)00062-9. [DOI] [PubMed] [Google Scholar]
- 38.Yau TO, Chan CF, Gee-San Lam S, Cheung OF, Ching YP, Jin DY, et al. Hepatocyte-specific activation of NF-kappaB does not aggravate chemical hepatocarcinogenesis in transgenic mice. J Pathol. 2009;217(3):353–361. doi: 10.1002/path.2451. [DOI] [PubMed] [Google Scholar]
- 39.Subramanian A, Tamayo P, Mootha VK, Mukherjee S, Ebert BL, Gillette MA, et al. Gene set enrichment analysis: a knowledge-based approach for interpreting genome-wide expression profiles. Proceedings of the National Academy of Sciences of the United States of America. 2005;102(43):15545–15550. doi: 10.1073/pnas.0506580102. [DOI] [PMC free article] [PubMed] [Google Scholar]
- 40.Bruix J, Sherman M. American Association for the Study of Liver D. Management of hepatocellular carcinoma: an update. Hepatology. 2011;53(3):1020–1022. doi: 10.1002/hep.24199. [DOI] [PMC free article] [PubMed] [Google Scholar]
- 41.Tian B, Nowak DE, Jamaluddin M, Wang S, Brasier AR. Identification of direct genomic targets downstream of the nuclear factor-kappaB transcription factor mediating tumor necrosis factor signaling. The Journal of biological chemistry. 2005;280(17):17435–17448. doi: 10.1074/jbc.M500437200. [DOI] [PubMed] [Google Scholar]
- 42.Hinata K, Gervin AM, Jennifer Zhang Y, Khavari PA. Divergent gene regulation and growth effects by NF-kappa B in epithelial and mesenchymal cells of human skin. Oncogene. 2003;22(13):1955–1964. doi: 10.1038/sj.onc.1206198. [DOI] [PubMed] [Google Scholar]
- 43.Delhase M, Hayakawa M, Chen Y, Karin M. Positive and negative regulation of IkappaB kinase activity through IKKbeta subunit phosphorylation. Science. 1999;284(5412):309–313. doi: 10.1126/science.284.5412.309. [DOI] [PubMed] [Google Scholar]
- 44.Saito M, Iwawaki T, Taya C, Yonekawa H, Noda M, Inui Y, et al. Diphtheria toxin receptor-mediated conditional and targeted cell ablation in transgenic mice. Nat Biotechnol. 2001;19(8):746–750. doi: 10.1038/90795. [DOI] [PubMed] [Google Scholar]
- 45.Huang LR, Wohlleber D, Reisinger F, Jenne CN, Cheng RL, Abdullah Z, et al. Intrahepatic myeloid-cell aggregates enable local proliferation of CD8(+) T cells and successful immunotherapy against chronic viral liver infection. Nat Immunol. 2013;14(6):574–583. doi: 10.1038/ni.2573. [DOI] [PubMed] [Google Scholar]
- 46.van de Wiel MA, Kim KI, Vosse SJ, van Wieringen WN, Wilting SM, Ylstra B. CGHcall: calling aberrations for array CGH tumor profiles. Bioinformatics. 2007;23(7):892–894. doi: 10.1093/bioinformatics/btm030. [DOI] [PubMed] [Google Scholar]
- 47.Venkatraman ES, Olshen AB. A faster circular binary segmentation algorithm for the analysis of array CGH data. Bioinformatics. 2007;23(6):657–663. doi: 10.1093/bioinformatics/btl646. [DOI] [PubMed] [Google Scholar]
- 48.van de Wiel MA, Wieringen WN. CGHregions: dimension reduction for array CGH data with minimal information loss. Cancer informatics. 2007;3:55–63. [PMC free article] [PubMed] [Google Scholar]
- 49.Hindson BJ, Ness KD, Masquelier DA, Belgrader P, Heredia NJ, Makarewicz AJ, et al. High-throughput droplet digital PCR system for absolute quantitation of DNA copy number. Anal Chem. 2011;83(22):8604–8610. doi: 10.1021/ac202028g. [DOI] [PMC free article] [PubMed] [Google Scholar]
Associated Data
This section collects any data citations, data availability statements, or supplementary materials included in this article.