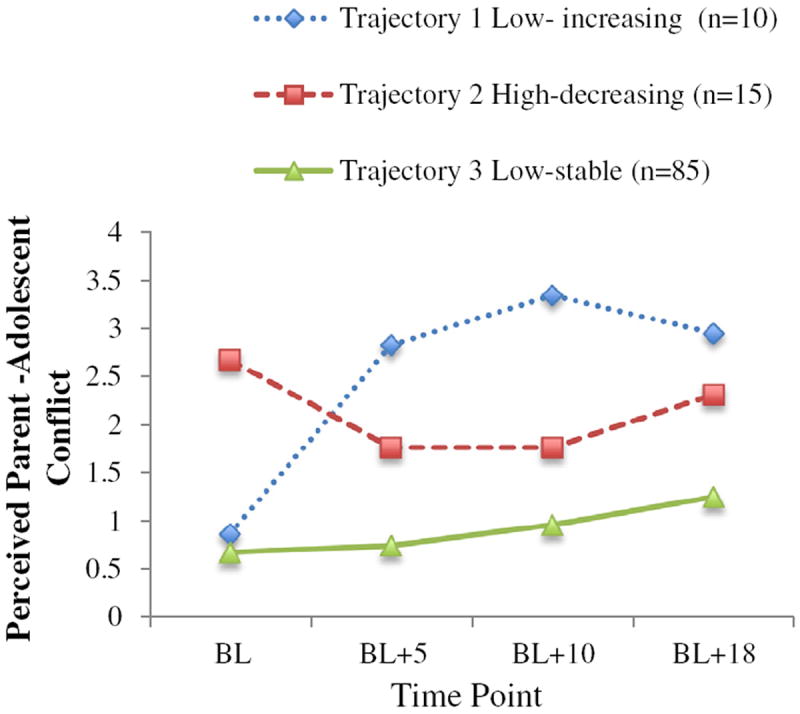
Fig. 1.

Perceived parent–adolescent conflict. This figure illustrates three trajectories of parent–adolescent relationship conflict with at-risk adolescents across a 1.5-year period. BL = baseline, BL + 5 = 5 months after baseline, BL + 10 = 10 months after baseline, and BL + 18 = 18 months after baseline. Trajectory 1 shows low levels of conflict at baseline and a sharp increase that remained high throughout the study. Trajectory 2 reflects relatively high levels of conflict throughout the study. Trajectory 3 shows low levels of conflict throughout the study.
