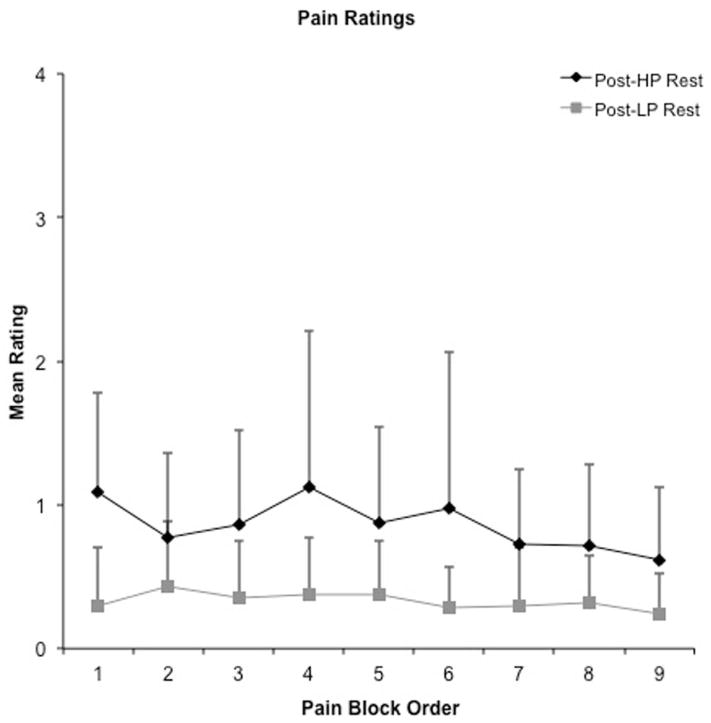
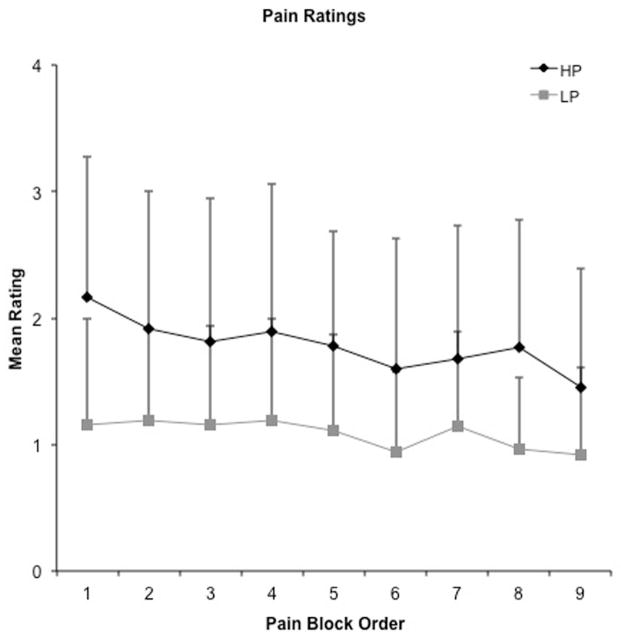
Figure 2.
Mean pain ratings as a function of rest (Top) and pain stimulus (Panel B, gray symbols) blocks. Rest blocks (inter-stimulus intervals) followed all stimulus blocks. Both post high pain block ratings (Post-HP) and high pain ratings (H) (black diamonds) were significantly higher than post low pain block ratings (Post-LP) and low pain ratings (LP) (grey squares) for both rest and pain blocks.


