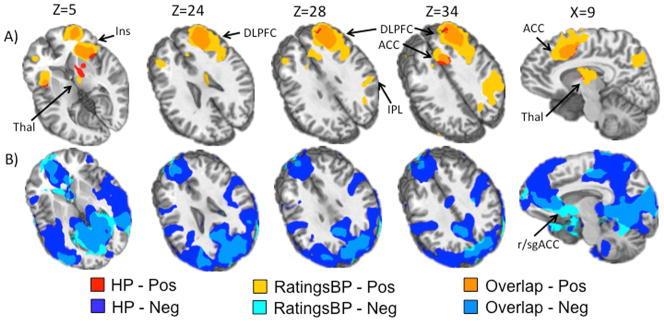
Figure 3.
This figure presents the results for the high pain regressor and the ratings regressor from the hierarchical regression where regressors were entered in the following order from first to last: low pain, high pain, button press, ratings. Of note the ratings regressor captured more extensive and unique positive activation above and beyond that of the high pain regressor. Panel A (top) shows areas of unique variance associated with the high pain regressor (HP; red), the ratings regressor after correcting for variance associated with the button press regressor (RatingsBP) (yellow), and overlap between the two (orange). Panel B (bottom) shows areas of unique variance associated with HP (dark blue), RatingsBP (light blue) and Overlap (medium blue). Regions indicated by arrows include 1) insula (Ins); 2) thalamus (Thal); 3) anterior cingulate cortex (ACC); 4) dorsolateral prefrontal cortex (DLPFC); 5) inferior parietal lobule (IPL); 6) rostral/subgenual ACC (r/sgACC). Slice locations (Z) are given according to the Talairach atlas.

