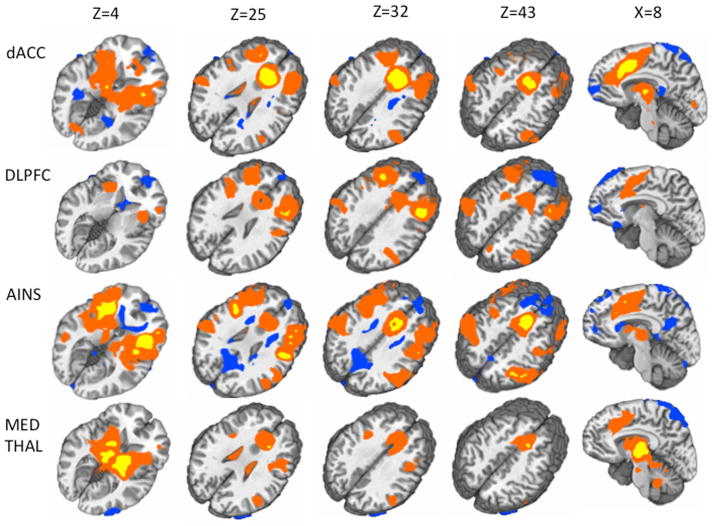
Figure 5.
This figure depicts the results from the connectivity analyses. Each row indicates the results for a different seed (from top to bottom: right dACC, right DLPFC, bilateral anterior insula, right medial thalamus). Each column represents a different slice location according to the Talairach atlas (from left to right: Z=4, Z=25, Z=43, X=8). Areas which were significantly positively correlated with seeds (positive Z scores) are displayed in this figure in either yellow (Fischer’s Z>10) or red (Fischer’s Z<10). Areas which were significantly negatively correlated with seeds (negative Z scores) are displayed in blue (Fischer’s Z<10).

