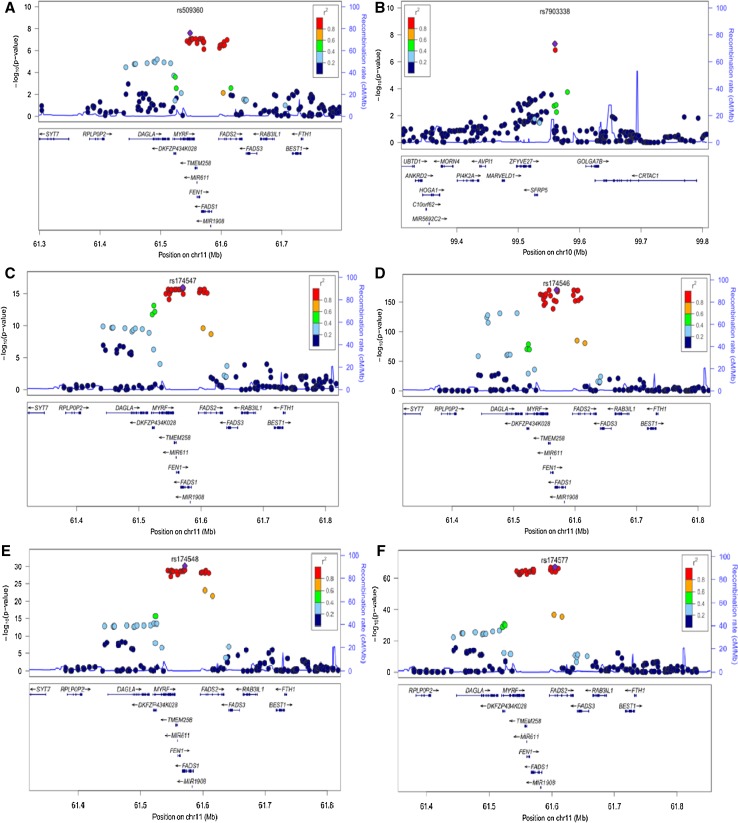
Fig. 1.
Regional plots of SNPs within 500 kb region of lead genome-wide SNP (SNP with strongest association level) for a ALA association in chromosome 11, b ALA association in chromosome 10, c LA association in chromosome 11, d GLA association in chromosome 11, e DGLA association in chromosome 11 and f AA association in chromosome 11. LD (r 2) data of SNPs based on ASN panels of 1000 Genome database. Plots plotted using LocusZoom (http://csg.sph.umich.edu/locuszoom/)

