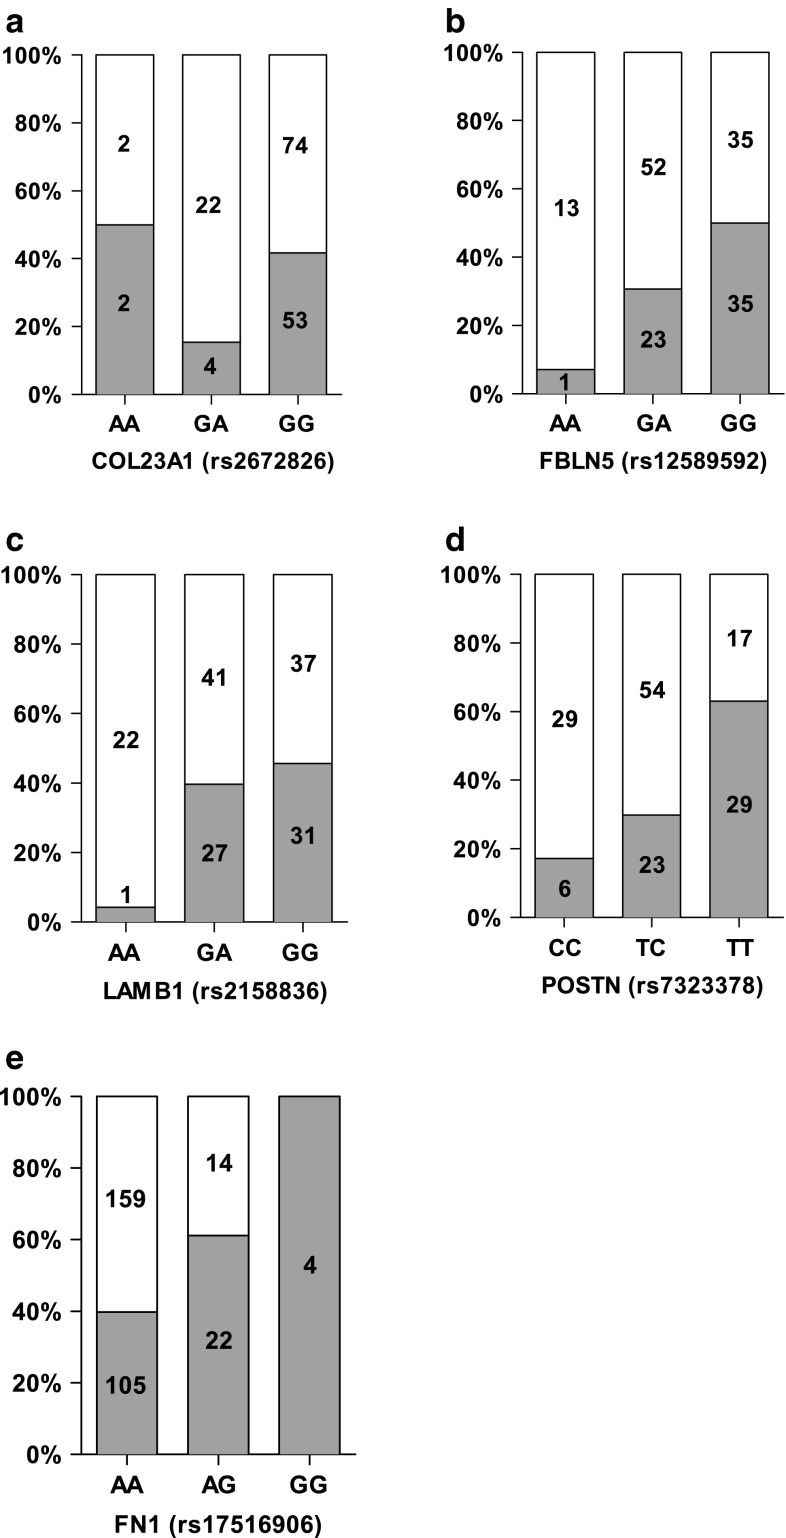
Fig. 1.
Percentage weight regain or maintenance phenotype of each genotype for the significant SNPs. Each bar represents the total amount of subjects having a specific genotype for a significant SNP: a COL23A1 (rs2672826), b FBLN5 (rs12589592), c LAMB1 (rs2158836), d POSTN (rs7323378), and e FN1 (rs17516906). a–d represent men, and e represents women. The grey bars indicate the percentage of weight maintainers (WM) with the genotype, and the white bars are for weight regainers (WR). The number within each bar is the count of participants having the specific genotype

