Fig. 1.

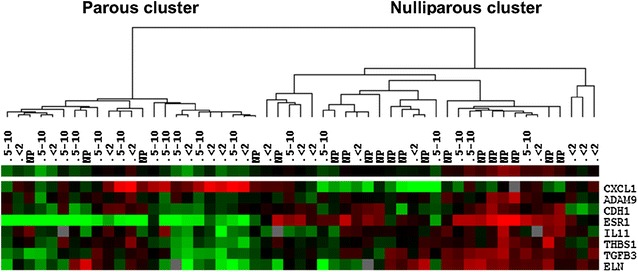
Clustering of tumor samples based on the genes significantly differently expressed between the nulliparous (NP) and parous (P) tumor samples. N NP = 19, N P = 34

Clustering of tumor samples based on the genes significantly differently expressed between the nulliparous (NP) and parous (P) tumor samples. N NP = 19, N P = 34