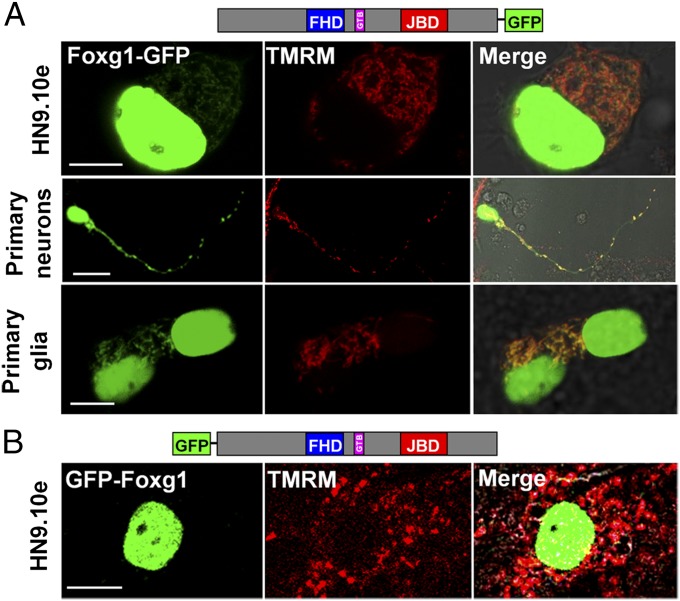
Fig. 2.
Foxg1-GFP and GFP-Foxg1 display different subcellular localizations. (A) Schematic representation of Foxg1-GFP and representative images of Foxg1-GFP-expressing cells loaded with TMRM. (B) Schematic representation of GFP-Foxg1 and representative images of GFP-Foxg1-expressing cells loaded with TMRM. Colocalization is indicated by yellow pixels in the merged images. (Scale bar, 5 µm.)

