Fig. 3.
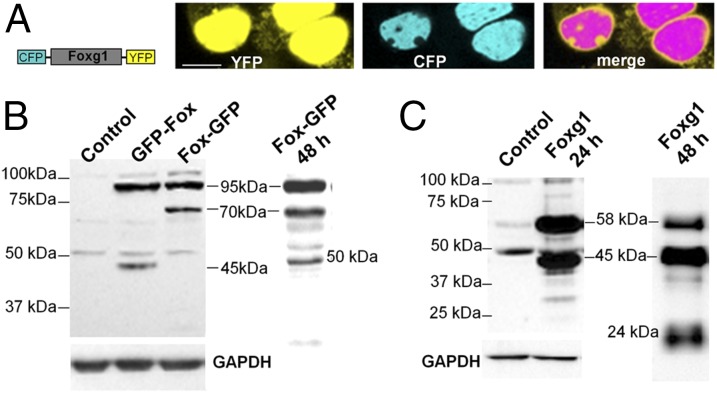
Imaging and WB assays on tagged and untagged Foxg1 overexpressing cells. (A) Schematic representation of CFP-Foxg1-YFP double-fusion protein and representative image of HN9.10e cells transiently transfected with the YFP-Foxg1-CFP construct. (Scale bar, 5 µm.) (B) WB assay on untransfected NIH 3T3 controls, GFP-Foxg1, and Foxg1-GFP overexpressing NIH 3T3 cells (whole lysate) processed 24 and 48 h after transfection; the filters were probed with an Ab against the Foxg1 C terminus. (C) WB assay on untransfected and untagged Foxg1-overexpressing NIH 3T3 cells (whole lysate) processed 24 and 48 h after transfection and probed with the same Ab as in B. See also Fig. S2 for schemes representing Foxg1 and its fluorescent fusion proteins.

