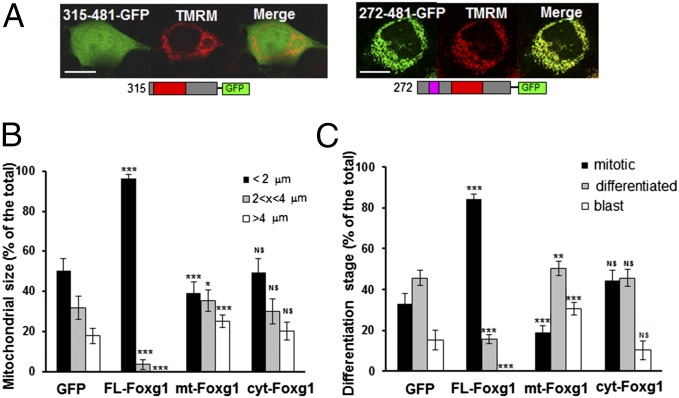
Fig. 5.
Cellular and mitochondrial morphology of HN9.10e cells overexpressing full-length and truncated Foxg1. (A) Exemplificative pictures of HN9.10e cells loaded with TMRM and expressing mt-Foxg1 (272–481) and cyt-Foxg1 (315–481) fused to GFP at their C terminus, and schematic representation of the constructs. (Scale bar, 5 µm.) (B) Distribution in three classes of length (<2 μm, 2–4 μm, or >4 μm) of mitochondria in HN9.10e cells transfected with either GFP alone or with GFP and untagged FL-Foxg1, mt-Foxg1 (272–481), or cyt-Foxg1 (315–481). (C) Percentages of mitotic cells, blasts, and early differentiating cells in HN9.10e transfected with either GFP alone or with GFP and untagged FL-Foxg1, mt-Foxg1 (272–481), or cyt-Foxg1 (315–481). T-test is referred to the GFP-transfected control sample. *P < 0.05, **P < 0.01, ***P < 0.001.

