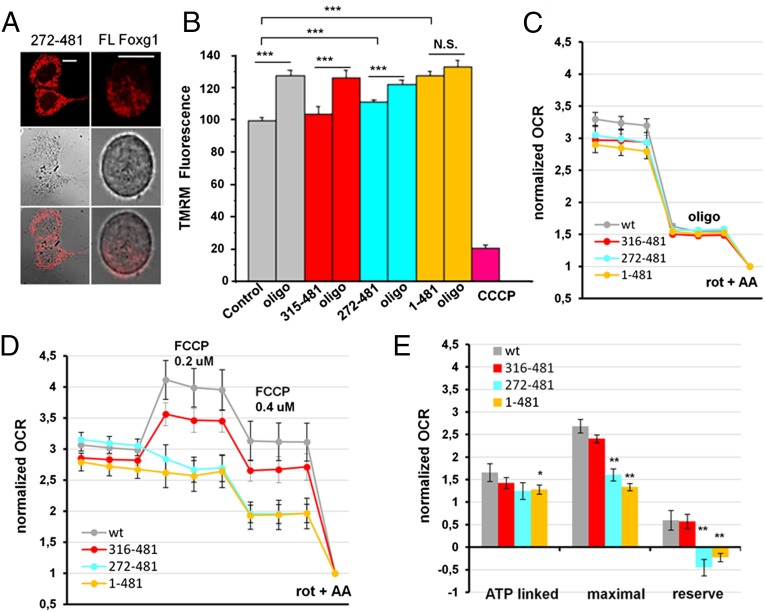
Fig. 6.
Mitochondrial membrane potential and cellular respiration in Foxg1-transfected HN9.10e cells. (A) Exemplificative pictures of untagged FL-Foxg1-expressing and mt-Foxg1-expressing (272–481) HN9.10e cells, loaded with TMRM. (Scale bar, 5 µm.) (B) TMRM fluorescence changes upon oligomycin application in mitochondria of HN9.10e cells transiently transfected with either GFP alone (control) or GFP and untagged FL-Foxg1 (1–481), mt-Foxg1 (272–481), or cyt-Foxg1 (315–481). Fluorescence was normalized to the mean TMRM fluorescence in control cells. (C and D) OCR normalized to OCR upon rotenone + antimycin A (nonmitochondrial OCR) of HN9.10e cells not transfected (wt) or transfected with FL-Foxg1, mt-Foxg1, or cyt-Foxg1. Cells have been challenged with oligomycin (C) or FCCP (D). Data represent mean ± SEM, n = 4 independent experiments, each condition replicated three to five times per experiment. (E) Quantification of the normalized OCR from C and D. *P < 0.05; **P < 0.01; ***P < 0.001.

