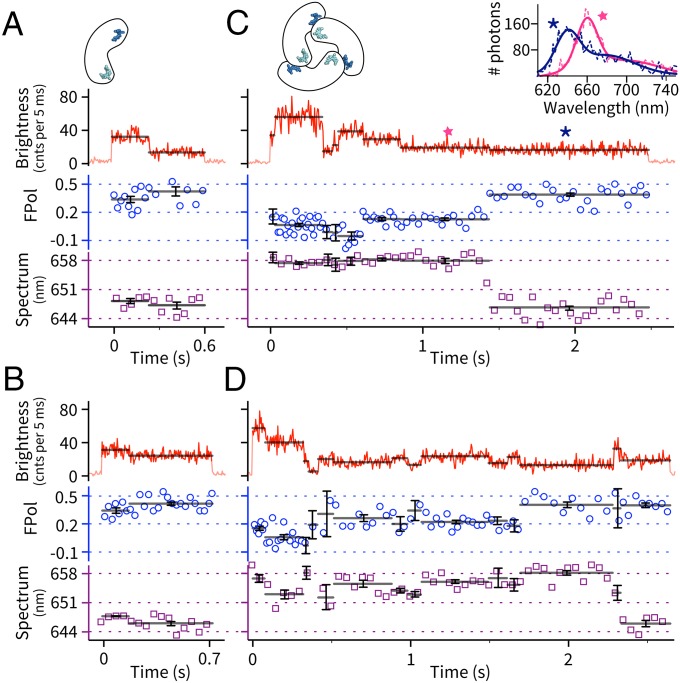
Fig. 2.
Simultaneously recorded brightness−FPol−spectrum dynamics of individual APC proteins in solution. (A and B) Two example molecules of the monomer. (C and D) Two example molecules of the trimer. Solid black lines indicate the mean parameter value of an identified brightness level. Error bars indicate 68% confidence intervals and are defined in SI Appendix, SI Materials and Methods. In the FPol channel, blue circles indicate FPol values calculated from every 250 total photons. In the spectral channel, purple squares indicate spectral CM of each 50-ms frame. (Inset) Full emission spectra (dashed, raw data; solid, double-Gaussian fits) of molecule C's last two emission levels (stars).

