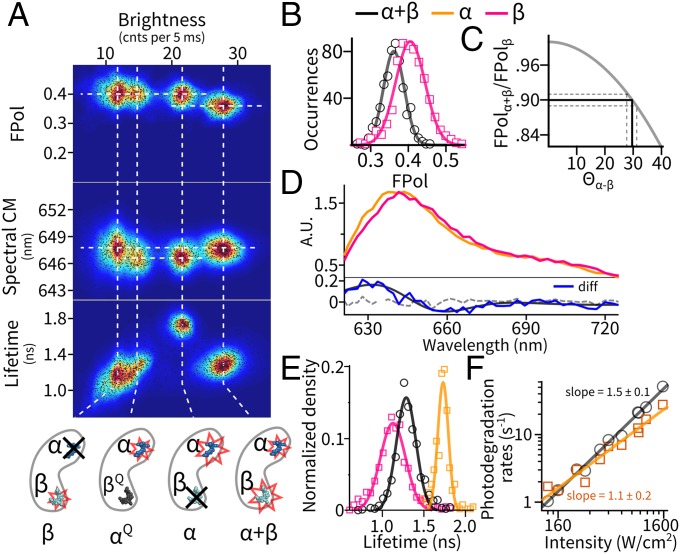
Fig. 3.
Pigment-specific dissection of the emission states of the monomer. (A) Multiparameter mapping of all emissive levels observed in APC monomers. Dashed lines are guides to the eye for alignment. State identifications are illustrated at the bottom; see Emission States of the Monomer for details. (B–F) Emissive properties of the states. The legends apply to all panels. (B) Distribution of FPol in the intact monomer (α+β, black) and the β-only state (red). (C) Estimation of the angular separation (Θα-β) between the α- and β-pigment dipoles on the monomer by a FRET model. Solid gray, expected FPol of the α+β state as a function of Θα-β; solid black, experimentally observed FPol and its corresponding Θα-β. Dashed lines indicate 95% confidence interval. (D, Top) Emission spectra of the individual α- and β-pigment sites. (Bottom) Difference spectrum (blue) between the two pigments. Dashed line denotes difference spectrum between two randomly picked subsets of the β-only state. (E) Decomposed excited-state lifetime distributions of the individual pigments and the intact monomer. (F) Power dependence of the photodegradation rates with fits to a power law.

