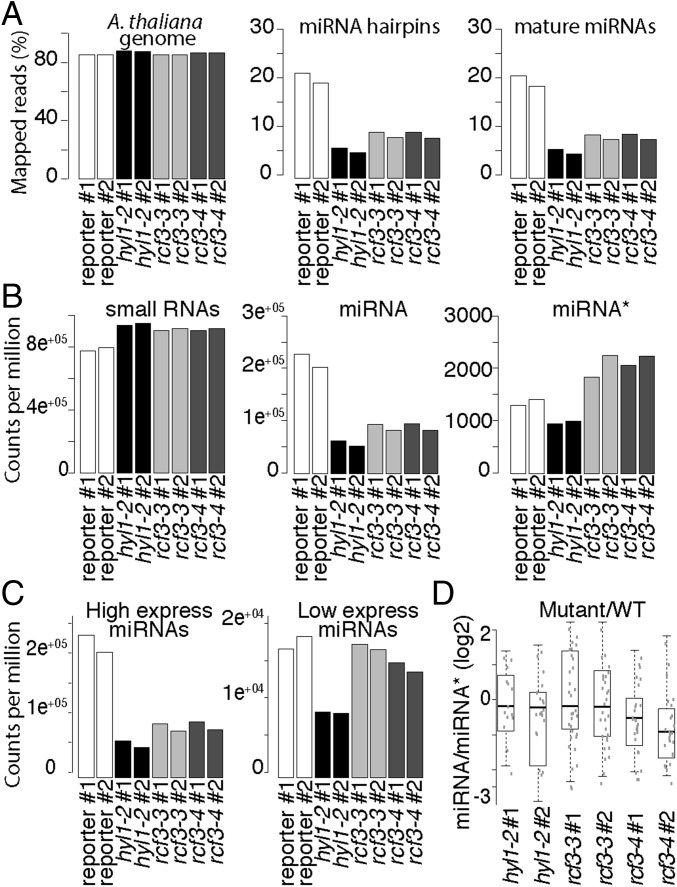
Fig. 4.
sRNA, miRNA, and miRNA* levels in rcf3 vegetative apices. (A) Fraction of reads mapping to the A. thaliana genome (TAIR 10), miRNA hairpins, and mature miRNAs. (B) Normalized counts per million mapped reads of all small RNAs, mature miRNAs, and miRNA*s. (C) Normalized counts per million mapped reads of highly and lowly expressed miRNAs. (D) Ratio of miRNA/miRNA* between mutants and control plants. For unique miRNAs (i.e., 156a-f), the ratio was calculated using the sum of all associated miRNA*s. The ratio was calculated only for those miRNAs that had greater than 2 counts per million in at least two samples. To compare the mutant to WT ratios, we first averaged the ratios of the WT replicates and then divided the mutant ratios by the mean WT ratio. The data were plotted as the log2 of the ratio mutant/WT showing misprocessed miRNAs as values below 0. Two biological replicates for each genotype: control miRNA-activity reporter line (reporter), hyl1-2, rcf3-3, rcf3-4.

